| Zacks Company Profile for NewtekOne, Inc. (NEWT : NSDQ) |
|
|
| |
| • Company Description |
| NewtekOne Inc. is a financial holding company, which along with its bank and non-bank consolidated subsidiaries, provides a wide range of business and financial solutions under the Newtek(R) brand to the small- and medium-sized business market. NewtekOne Inc., formerly known as Newtek Business Services Corp., is based in BOCA RATON, Fla.
Number of Employees: 572 |
|
|
| |
| • Price / Volume Information |
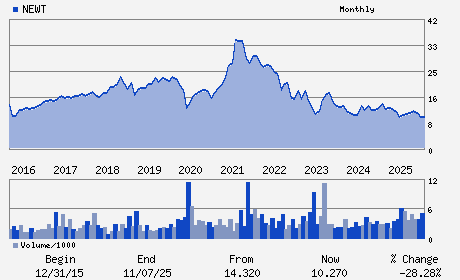
| Yesterday's Closing Price: $13.38 |
Daily Weekly Monthly
 |
| 20 Day Moving Average: 183,079 shares |
| Shares Outstanding: 28.86 (millions) |
| Market Capitalization: $386.13 (millions) |
| Beta: 1.27 |
| 52 Week High: $14.91 |
| 52 Week Low: $9.59 |
| Short Interest Ratio: |
| |
% Price Change |
% Price Change Relative to S&P 500 |
| 4 Week |
6.78% |
1.57% |
| 12 Week |
5.27% |
-2.68% |
| Year To Date |
17.89% |
7.65% |
|
|
|
|
| |
|
|
| |
| • General Corporate Information |
Officers
Barry Sloane - Chief Executive Officer; President and Chairman
Frank DeMaria - Executive Vice President; Chief Financial Officer
Richard Salute - Director
Gregory Zink - Director
Craig Brunet - Director
|
|
Peer Information
NewtekOne, Inc. (EIIN)
NewtekOne, Inc. (AFMI)
NewtekOne, Inc. (DRL)
NewtekOne, Inc. (GRFPY)
NewtekOne, Inc. (IGOT)
NewtekOne, Inc. (ATLC)
|
|
Industry / Sector / Ticker Info
Analyst Coverage: No
Industry Group: FIN-MISC SVCS
Sector: Finance
CUSIP: 652526203
SIC: 6021
|
|
Fiscal Year
Fiscal Year End: December
Last Reported Quarter: 03/01/26
Next Expected EPS Date: 07/27/26
|
|
Share - Related Items
Shares Outstanding: 28.86
Most Recent Split Date: 10.00 (0.20:1)
Beta: 1.27
Market Capitalization: $386.13 (millions)
|
|
|
|
|
| |
| • EPS Information |
• Dividend Information |
| Analyst Coverage: No |
Dividend Yield: 5.68% |
| Current Fiscal Quarter EPS Consensus Estimate: $0.46 |
Indicated Annual Dividend: $0.76 |
| Current Fiscal Year EPS Consensus Estimate: $2.38 |
Payout Ratio: 0.33 |
| Number of Estimates in the Fiscal Year Consensus: 4.00 |
Change In Payout Ratio: -0.37 |
| Estmated Long-Term EPS Growth Rate: % |
Last Dividend Paid: NA - $0.00 |
| Next EPS Report Date: 07/27/26 |
|
|
|
| |