| Zacks Company Profile for NN, Inc. (NNBR : NSDQ) |
|
|
| |
| • Company Description |
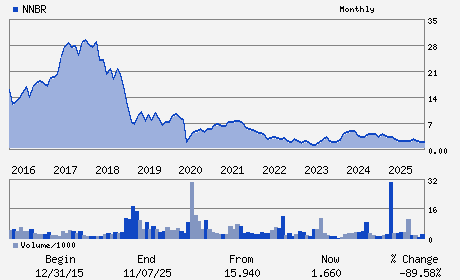
| NN Inc., a global diversified industrial company, combines advanced engineering and production capabilities with in-depth materials science expertise to design and manufacture high-precision components and assemblies for a variety of markets on a global basis. Headquartered in Charlotte, North Carolina, NN has facilities in North America, Europe, South America, and Asia.
Number of Employees: 2,550 |
|
|
| |
| • Price / Volume Information |
| Yesterday's Closing Price: $2.45 |
Daily Weekly Monthly
 |
| 20 Day Moving Average: 1,007,137 shares |
| Shares Outstanding: 52.77 (millions) |
| Market Capitalization: $129.30 (millions) |
| Beta: 2.54 |
| 52 Week High: $2.99 |
| 52 Week Low: $1.10 |
| Short Interest Ratio: |
| |
% Price Change |
% Price Change Relative to S&P 500 |
| 4 Week |
-6.13% |
-10.72% |
| 12 Week |
63.33% |
50.99% |
| Year To Date |
91.41% |
73.82% |
|
|
|
|
| |
| • Address & Contact Information |
| Street Address |
Phone / Fax |
Email Address |
Web URL |
6210 Ardrey Kell Road Suite 120
-
Charlotte,NC 28277
USA |
ph: 980-264-4300
fax: 423-743-2670 |
nnbr@alpha-ir.com |
http://www.nninc.com |
|
|
| |
| • General Corporate Information |
Officers
Harold C. Bevis - President; Chief Executive Officer and Director
Jeri J. Harman - Non-Executive Chairman; Director
Christopher H. Bohnert - Senior Vice President and Chief Financial Officer
Raynard D. Benvenuti - Director
Christina E. Carroll - Director
|
|
Peer Information
NN, Inc. (DCS.)
NN, Inc. (CPTD)
NN, Inc. (HIHO)
NN, Inc. (T.GNA)
NN, Inc. (HTLJ)
NN, Inc. (CENX)
|
|
Industry / Sector / Ticker Info
Analyst Coverage: No
Industry Group: METAL PROC&FABR
Sector: Industrial Products
CUSIP: 629337106
SIC: 3540
|
|
Fiscal Year
Fiscal Year End: December
Last Reported Quarter: 03/01/26
Next Expected EPS Date: 08/05/26
|
|
Share - Related Items
Shares Outstanding: 52.77
Most Recent Split Date: 12.00 (1.50:1)
Beta: 2.54
Market Capitalization: $129.30 (millions)
|
|
|
|
|
| |
| • EPS Information |
• Dividend Information |
| Analyst Coverage: No |
Dividend Yield: 0.00% |
| Current Fiscal Quarter EPS Consensus Estimate: $0.04 |
Indicated Annual Dividend: $0.00 |
| Current Fiscal Year EPS Consensus Estimate: $0.12 |
Payout Ratio: 0.00 |
| Number of Estimates in the Fiscal Year Consensus: 2.00 |
Change In Payout Ratio: |
| Estmated Long-Term EPS Growth Rate: 45.00% |
Last Dividend Paid: NA - $0.00 |
| Next EPS Report Date: 08/05/26 |
|
|
|
| |