| Zacks Company Profile for Northland Power, Inc. (NPIFF : OTC) |
|
|
| |
| • Company Description |
| Northland Power Inc. is a power producer. It involved in developing, building, owning and operating a diversified mix of energy infrastructure assets including offshore and onshore wind, solar, battery energy storage and natural gas. Northland Power Inc. is based in TORONTO.
Number of Employees: |
|
|
| |
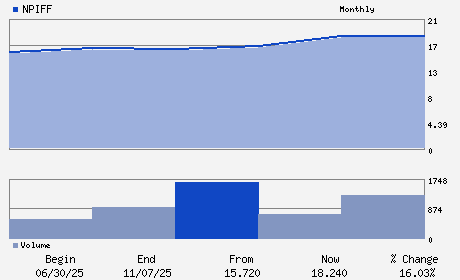
| • Price / Volume Information |
| Yesterday's Closing Price: $16.86 |
Daily Weekly Monthly
 |
| 20 Day Moving Average: 52,907 shares |
| Shares Outstanding: 261.50 (millions) |
| Market Capitalization: $4,410.20 (millions) |
| Beta: |
| 52 Week High: $18.44 |
| 52 Week Low: $11.43 |
| Short Interest Ratio: |
| |
% Price Change |
% Price Change Relative to S&P 500 |
| 4 Week |
0.03% |
-4.86% |
| 12 Week |
10.59% |
2.24% |
| Year To Date |
29.63% |
18.09% |
|
|
|
|
| |
|
|
| |
| • General Corporate Information |
Officers
Christine Healy - Chief Executive Officer and President
Ian Pearce - Chair of the Board and Director
Jeff Hart - Chief Financial Officer
Toby Edmonds - Executive Vice President
Calvin MacCormack - Executive Vice President
|
|
Peer Information
Northland Power, Inc. (APWR)
Northland Power, Inc. (USFCQ)
Northland Power, Inc. (SGII.)
Northland Power, Inc. (APGI)
Northland Power, Inc. (HYDP)
Northland Power, Inc. (FCEL)
|
|
Industry / Sector / Ticker Info
Analyst Coverage: No
Industry Group: Other Alt Energy
Sector: Oils/Energy
CUSIP: 666511100
SIC: -
|
|
Fiscal Year
Fiscal Year End: December
Last Reported Quarter: 03/01/26
Next Expected EPS Date: 08/12/26
|
|
Share - Related Items
Shares Outstanding: 261.50
Most Recent Split Date: (:1)
Beta:
Market Capitalization: $4,410.20 (millions)
|
|
|
|
|
| |
| • EPS Information |
• Dividend Information |
| Analyst Coverage: No |
Dividend Yield: 3.14% |
| Current Fiscal Quarter EPS Consensus Estimate: $ |
Indicated Annual Dividend: $0.53 |
| Current Fiscal Year EPS Consensus Estimate: $ |
Payout Ratio: 0.41 |
| Number of Estimates in the Fiscal Year Consensus: |
Change In Payout Ratio: 0.27 |
| Estmated Long-Term EPS Growth Rate: % |
Last Dividend Paid: 04/30/2026 - $0.08 |
| Next EPS Report Date: 08/12/26 |
|
|
|
| |