| Zacks Company Profile for Naspers Ltd. (NPSNY : OTC) |
|
|
| |
| • Company Description |
| Naspers Limited is a multinational media group with its principal operations in pay television and Internet subscriber platforms, print media, book publishing, private education and technology markets. The group's activities are conducted through subsidiaries, joint ventures and associated companies. Naspers' most significant operations are located in South Africa, and it has major operations elsewhere in Africa, as well as in Greece, Cyprus and Asia.
Number of Employees: 27,010 |
|
|
| |
| • Price / Volume Information |
| Yesterday's Closing Price: $10.35 |
Daily Weekly Monthly
 |
| 20 Day Moving Average: 150,415 shares |
| Shares Outstanding: 3,947.18 (millions) |
| Market Capitalization: $40,853.26 (millions) |
| Beta: 0.49 |
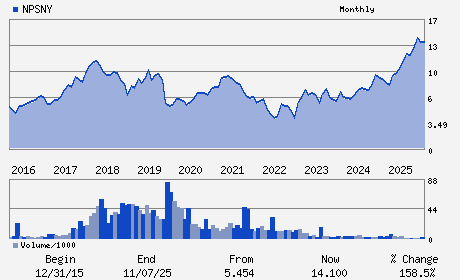
| 52 Week High: $15.15 |
| 52 Week Low: $9.90 |
| Short Interest Ratio: |
| |
% Price Change |
% Price Change Relative to S&P 500 |
| 4 Week |
-4.78% |
-9.44% |
| 12 Week |
-8.00% |
-14.95% |
| Year To Date |
-22.18% |
-26.93% |
|
|
|
|
| |
|
|
| |
| • General Corporate Information |
Officers
Fabricio Bloisi - Chief Executive Officer and Executive Director
Koos Bekker - Chairman
Nico Marais - Chief Financial Officer
Lynelle Bagwandeen - Company secretary
Phuthi Mahanyele-Dabengwa - Director
|
|
Peer Information
Naspers Ltd. (CMCSK)
Naspers Ltd. (CMCSA)
Naspers Ltd. (T.CH)
Naspers Ltd. (NCNXQ)
Naspers Ltd. (T.CSQ)
Naspers Ltd. (AMCM)
|
|
Industry / Sector / Ticker Info
Analyst Coverage: No
Industry Group: CABLE TV
Sector: Consumer Discretionary
CUSIP: 631512209
SIC: 7310
|
|
Fiscal Year
Fiscal Year End: March
Last Reported Quarter: -
Next Expected EPS Date: 06/22/26
|
|
Share - Related Items
Shares Outstanding: 3,947.18
Most Recent Split Date: 10.00 (5.00:1)
Beta: 0.49
Market Capitalization: $40,853.26 (millions)
|
|
|
|
|
| |
| • EPS Information |
• Dividend Information |
| Analyst Coverage: No |
Dividend Yield: 0.35% |
| Current Fiscal Quarter EPS Consensus Estimate: $ |
Indicated Annual Dividend: $0.04 |
| Current Fiscal Year EPS Consensus Estimate: $1.09 |
Payout Ratio: |
| Number of Estimates in the Fiscal Year Consensus: 2.00 |
Change In Payout Ratio: |
| Estmated Long-Term EPS Growth Rate: 16.91% |
Last Dividend Paid: NA - $0.00 |
| Next EPS Report Date: 06/22/26 |
|
|
|
| |