| Zacks Company Profile for Newton Golf Company, Inc. (NWTG : NSDQ) |
|
|
| |
| • Company Description |
| Newton Golf Company is a technology-driven golf company. Its portfolio includes golf shafts, putters, grips and other golf-related accessories designed for golfers. Newton Golf Company, formerly known as Sacks Parente Golf Inc., is based in CAMARILLO, Calif.
Number of Employees: 46 |
|
|
| |
| • Price / Volume Information |
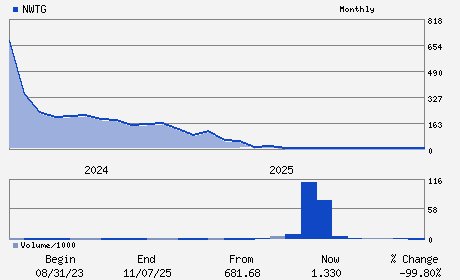
| Yesterday's Closing Price: $1.34 |
Daily Weekly Monthly
 |
| 20 Day Moving Average: 34,106 shares |
| Shares Outstanding: 4.59 (millions) |
| Market Capitalization: $6.15 (millions) |
| Beta: 3.57 |
| 52 Week High: $2.57 |
| 52 Week Low: $0.82 |
| Short Interest Ratio: |
| |
% Price Change |
% Price Change Relative to S&P 500 |
| 4 Week |
-18.79% |
-23.39% |
| 12 Week |
-19.76% |
-21.44% |
| Year To Date |
-10.67% |
-12.92% |
|
|
|
|
| |
|
|
| |
| • General Corporate Information |
Officers
Akinobu Yorihiro - Interim Chief Executive Officer
Brett Hoge - Chairman
Jeff Clayborne - Chief Financial Officer; Chief Operating Officer
John Bode - Director
Greg Campbell - Director
|
|
Peer Information
Newton Golf Company, Inc. (BAJAY)
Newton Golf Company, Inc. (ESCA)
Newton Golf Company, Inc. (GOYL)
Newton Golf Company, Inc. (FTSP)
Newton Golf Company, Inc. (KTO)
Newton Golf Company, Inc. (BOLL)
|
|
Industry / Sector / Ticker Info
Analyst Coverage: No
Industry Group: LEISURE&REC PRD
Sector: Consumer Discretionary
CUSIP: 78577G301
SIC: 3949
|
|
Fiscal Year
Fiscal Year End: December
Last Reported Quarter: 12/01/25
Next Expected EPS Date: 05/21/26
|
|
Share - Related Items
Shares Outstanding: 4.59
Most Recent Split Date: 3.00 (0.03:1)
Beta: 3.57
Market Capitalization: $6.15 (millions)
|
|
|
|
|
| |
| • EPS Information |
• Dividend Information |
| Analyst Coverage: No |
Dividend Yield: 0.00% |
| Current Fiscal Quarter EPS Consensus Estimate: $ |
Indicated Annual Dividend: $0.00 |
| Current Fiscal Year EPS Consensus Estimate: $-0.48 |
Payout Ratio: |
| Number of Estimates in the Fiscal Year Consensus: 1.00 |
Change In Payout Ratio: |
| Estmated Long-Term EPS Growth Rate: % |
Last Dividend Paid: NA - $0.00 |
| Next EPS Report Date: 05/21/26 |
|
|
|
| |