| Zacks Company Profile for Nexstar Media Group, Inc. (NXST : NSDQ) |
|
|
| |
| • Company Description |
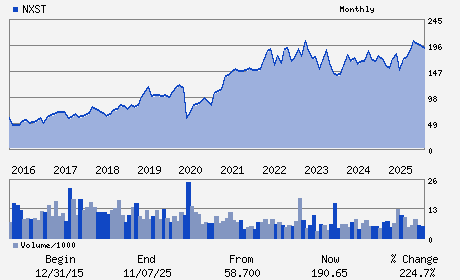
| Nexstar Media Group Inc. is a diversified media company which produces and distributes engaging local and national news, sports and entertainment content across its television and digital platforms. Nexstar Media Group Inc., formerly known as NEXSTAR BRDCSTG, is based in IRVING, Texas.
Number of Employees: 12,832 |
|
|
| |
| • Price / Volume Information |
| Yesterday's Closing Price: $196.59 |
Daily Weekly Monthly
 |
| 20 Day Moving Average: 564,055 shares |
| Shares Outstanding: 30.33 (millions) |
| Market Capitalization: $5,961.83 (millions) |
| Beta: 0.93 |
| 52 Week High: $254.30 |
| 52 Week Low: $141.66 |
| Short Interest Ratio: |
| |
% Price Change |
% Price Change Relative to S&P 500 |
| 4 Week |
-14.16% |
-19.02% |
| 12 Week |
-7.45% |
-9.39% |
| Year To Date |
-3.18% |
-5.63% |
|
|
|
|
| |
| • Address & Contact Information |
| Street Address |
Phone / Fax |
Email Address |
Web URL |
545 EAST JOHN CARPENTER FREEWAY SUITE 700
-
IRVING,TX 75062
USA |
ph: 972-373-8800
fax: 972-373-8888 |
nxst@jcir.com |
http://www.nexstar.tv |
|
|
| |
| • General Corporate Information |
Officers
Perry A. Sook - Chairman and Chief Executive Officer
Lee Ann Gliha - Chief Financial Officer
Geoff Armstrong - Director
Bernadette Aulestia - Director
Jay M. Grossman - Director
|
|
Peer Information
Nexstar Media Group, Inc. (PSO)
Nexstar Media Group, Inc. (LSXMK)
Nexstar Media Group, Inc. (ACCS)
Nexstar Media Group, Inc. (TKVR)
Nexstar Media Group, Inc. (TST)
Nexstar Media Group, Inc. (PARAA)
|
|
Industry / Sector / Ticker Info
Analyst Coverage: No
Industry Group: MEDIA CONGLOM
Sector: Consumer Discretionary
CUSIP: 65336K103
SIC: 4833
|
|
Fiscal Year
Fiscal Year End: December
Last Reported Quarter: 12/01/25
Next Expected EPS Date: 05/07/26
|
|
Share - Related Items
Shares Outstanding: 30.33
Most Recent Split Date: (:1)
Beta: 0.93
Market Capitalization: $5,961.83 (millions)
|
|
|
|
|
| |
| • EPS Information |
• Dividend Information |
| Analyst Coverage: No |
Dividend Yield: 3.78% |
| Current Fiscal Quarter EPS Consensus Estimate: $5.09 |
Indicated Annual Dividend: $7.44 |
| Current Fiscal Year EPS Consensus Estimate: $25.47 |
Payout Ratio: 0.58 |
| Number of Estimates in the Fiscal Year Consensus: 3.00 |
Change In Payout Ratio: 0.27 |
| Estmated Long-Term EPS Growth Rate: 10.00% |
Last Dividend Paid: 02/13/2026 - $1.86 |
| Next EPS Report Date: 05/07/26 |
|
|
|
| |