| Zacks Company Profile for Ollie's Bargain Outlet Holdings, Inc. (OLLI : NSDQ) |
|
|
| |
| • Company Description |
| Ollie's Bargain Outlet Holdings, Inc. is a value retailer of brand name merchandise at drastically reduced prices. The company offers products principally under Ollie's, Ollie's Bargain Outlet, Good Stuff Cheap, Ollie's Army, Real Brands Real Cheap!, Real Brands! Real Bargains!, Sarasota Breeze, Steelton Tools, American Way and Commonwealth Classics.
Number of Employees: 13,000 |
|
|
| |
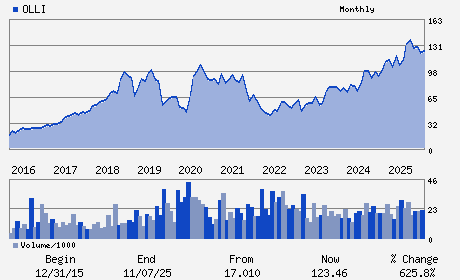
| • Price / Volume Information |
| Yesterday's Closing Price: $81.84 |
Daily Weekly Monthly
 |
| 20 Day Moving Average: 1,593,657 shares |
| Shares Outstanding: 60.66 (millions) |
| Market Capitalization: $4,964.50 (millions) |
| Beta: 0.48 |
| 52 Week High: $141.74 |
| 52 Week Low: $73.32 |
| Short Interest Ratio: |
| |
% Price Change |
% Price Change Relative to S&P 500 |
| 4 Week |
-7.26% |
-11.79% |
| 12 Week |
-24.14% |
-29.87% |
| Year To Date |
-25.34% |
-30.32% |
|
|
|
|
| |
| • Address & Contact Information |
| Street Address |
Phone / Fax |
Email Address |
Web URL |
6295 ALLENTOWN BOULEVARD SUITE 1
-
HARRISBURG,PA 17112
USA |
ph: 717-657-2300
fax: - |
jrouleau@ollies.us |
http://www.ollies.us |
|
|
| |
| • General Corporate Information |
Officers
Eric van der Valk - President and Chief Executive Officer
John Swygert - Executive Chairman
Robert Helm - Executive Vice President and Chief Financial Offic
Alissa Ahlman - Director
Mary Baglivo - Director
|
|
Peer Information
Ollie's Bargain Outlet Holdings, Inc. (EPC)
Ollie's Bargain Outlet Holdings, Inc. (HPPS)
Ollie's Bargain Outlet Holdings, Inc. (ADRNY)
Ollie's Bargain Outlet Holdings, Inc. (YHGJ)
Ollie's Bargain Outlet Holdings, Inc. (GPSYY)
Ollie's Bargain Outlet Holdings, Inc. (HENKY)
|
|
Industry / Sector / Ticker Info
Analyst Coverage: No
Industry Group: CONS PD- MISC STPL
Sector: Consumer Staples
CUSIP: 681116109
SIC: 5331
|
|
Fiscal Year
Fiscal Year End: January
Last Reported Quarter: 01/01/26
Next Expected EPS Date: 06/03/26
|
|
Share - Related Items
Shares Outstanding: 60.66
Most Recent Split Date: (:1)
Beta: 0.48
Market Capitalization: $4,964.50 (millions)
|
|
|
|
|
| |
| • EPS Information |
• Dividend Information |
| Analyst Coverage: No |
Dividend Yield: 0.00% |
| Current Fiscal Quarter EPS Consensus Estimate: $1.16 |
Indicated Annual Dividend: $0.00 |
| Current Fiscal Year EPS Consensus Estimate: $4.48 |
Payout Ratio: 0.00 |
| Number of Estimates in the Fiscal Year Consensus: 7.00 |
Change In Payout Ratio: 0.00 |
| Estmated Long-Term EPS Growth Rate: 12.73% |
Last Dividend Paid: NA - $0.00 |
| Next EPS Report Date: 06/03/26 |
|
|
|
| |