| Zacks Company Profile for Onterris, Inc. (ONT : NYSE) |
|
|
| |
| • Company Description |
| Onterris Inc. is an environmental solutions company partnering with organizations to solve complex challenges where environmental pressures, regulatory expectations and operational risks intersect. The Company's solutions are Contaminated Land & Remediation, Permitting & Compliance, Planning, Preparedness, Response & Recovery, Health, Safety & Chemistry, Testing & Analysis, Water Consulting, Testing & Treatment, Community Resiliency, and Natural Resources. Onterris Inc., formerly known as Montrose Environmental Group Inc., is based in United States.
Number of Employees: 3,500 |
|
|
| |
| • Price / Volume Information |
| Yesterday's Closing Price: $13.95 |
Daily Weekly Monthly
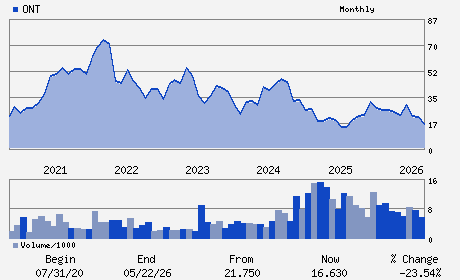 |
| 20 Day Moving Average: 814,841 shares |
| Shares Outstanding: 35.12 (millions) |
| Market Capitalization: $489.89 (millions) |
| Beta: 1.83 |
| 52 Week High: $30.00 |
| 52 Week Low: $12.26 |
| Short Interest Ratio: |
| |
% Price Change |
% Price Change Relative to S&P 500 |
| 4 Week |
-18.04% |
-18.58% |
| 12 Week |
-31.04% |
-34.96% |
| Year To Date |
-43.82% |
-50.42% |
|
|
|
|
| |
| • Address & Contact Information |
| Street Address |
Phone / Fax |
Email Address |
Web URL |
5120 Northshore Drive
-
North Little Rock,AR 72118
USA |
ph: 501-900-6400
fax: - |
ir@onterris.com |
http://www.onterris.com |
|
|
| |
| • General Corporate Information |
Officers
Vijay Manthripragada - President and Chief Executive Officer
Richard E. Perlman - Chairman
Allan Dicks - Chief Financial Officer
Vincent Colman - Director
Peter M. Graham - Director
|
|
Peer Information
Onterris, Inc. (AXIHQ)
Onterris, Inc. (CLIK)
Onterris, Inc. (NEWZ.)
Onterris, Inc. (DSEN)
Onterris, Inc. (IUSA.)
Onterris, Inc. (IDC)
|
|
Industry / Sector / Ticker Info
Analyst Coverage: No
Industry Group: BUSINESS INFO SVC
Sector: Business Services
CUSIP: 615111101
SIC: 8742
|
|
Fiscal Year
Fiscal Year End: December
Last Reported Quarter: 06/01/26
Next Expected EPS Date: 11/04/26
|
|
Share - Related Items
Shares Outstanding: 35.12
Most Recent Split Date: (:1)
Beta: 1.83
Market Capitalization: $489.89 (millions)
|
|
|
|
|
| |
| • EPS Information |
• Dividend Information |
| Analyst Coverage: No |
Dividend Yield: 0.00% |
| Current Fiscal Quarter EPS Consensus Estimate: $0.29 |
Indicated Annual Dividend: $0.00 |
| Current Fiscal Year EPS Consensus Estimate: $0.74 |
Payout Ratio: 0.00 |
| Number of Estimates in the Fiscal Year Consensus: 3.00 |
Change In Payout Ratio: |
| Estmated Long-Term EPS Growth Rate: 13.15% |
Last Dividend Paid: NA - $0.00 |
| Next EPS Report Date: 11/04/26 |
|
|
|
| |