| Zacks Company Profile for Orange (ORANY : OTC) |
|
|
| |
| • Company Description |
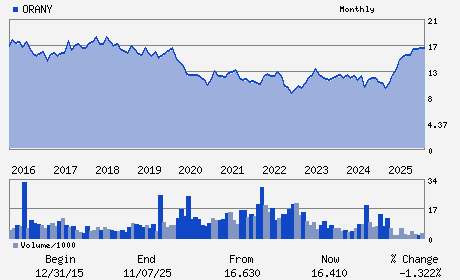
| Orange SA provides telecommunications services. It offers a range of fixed telephony and mobile telecommunications, data transmission, Internet and multimedia, and other value-added services to consumers, businesses, and other telecommunications operators under the Orange brand worldwide. Orange SA, formerly known as France Telecom S.A., is based in Paris, France.
Number of Employees: |
|
|
| |
| • Price / Volume Information |
| Yesterday's Closing Price: $20.86 |
Daily Weekly Monthly
 |
| 20 Day Moving Average: 108,984 shares |
| Shares Outstanding: 2,660.06 (millions) |
| Market Capitalization: $55,483.46 (millions) |
| Beta: 0.06 |
| 52 Week High: $21.47 |
| 52 Week Low: $13.65 |
| Short Interest Ratio: |
| |
% Price Change |
% Price Change Relative to S&P 500 |
| 4 Week |
4.29% |
-1.62% |
| 12 Week |
23.27% |
20.69% |
| Year To Date |
24.97% |
21.82% |
|
|
|
|
| |
|
|
| |
| • General Corporate Information |
Officers
Christel Heydemann - Chief Executive Officer
Jacques Aschenbroich - Chairman
Gilles Grapinet - Director
Valerie Beaulieu - Director
Frederic Sanchez - Director
|
|
Peer Information
Orange (ORANY)
Orange (QBCRF)
Orange (VOD)
Orange (TIMB)
Orange (PHI)
Orange (IRIDQ)
|
|
Industry / Sector / Ticker Info
Analyst Coverage: No
Industry Group: Wireless Non-US
Sector: Computer and Technology
CUSIP: 684060106
SIC: 4813
|
|
Fiscal Year
Fiscal Year End: December
Last Reported Quarter: -
Next Expected EPS Date: -
|
|
Share - Related Items
Shares Outstanding: 2,660.06
Most Recent Split Date: (:1)
Beta: 0.06
Market Capitalization: $55,483.46 (millions)
|
|
|
|
|
| |
| • EPS Information |
• Dividend Information |
| Analyst Coverage: No |
Dividend Yield: 2.22% |
| Current Fiscal Quarter EPS Consensus Estimate: $ |
Indicated Annual Dividend: $0.46 |
| Current Fiscal Year EPS Consensus Estimate: $1.24 |
Payout Ratio: |
| Number of Estimates in the Fiscal Year Consensus: 2.00 |
Change In Payout Ratio: |
| Estmated Long-Term EPS Growth Rate: % |
Last Dividend Paid: NA - $0.00 |
| Next EPS Report Date: - |
|
|
|
| |