| Zacks Company Profile for OSR Holdings, Inc. (OSRH : NSDQ) |
|
|
| |
| • Company Description |
| Bellevue Life Sciences Acquisition Corp. is a blank check company. It focuses on effecting a merger, share exchange, asset acquisition, stock purchase, recapitalization, reorganization or similar business combination with one or more businesses or entities. Bellevue Life Sciences Acquisition Corp. is based in Bellevue, Washington.
Number of Employees: 4 |
|
|
| |
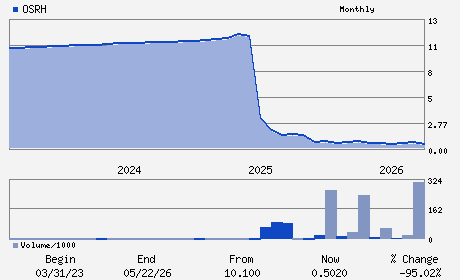
| • Price / Volume Information |
| Yesterday's Closing Price: $0.50 |
Daily Weekly Monthly
 |
| 20 Day Moving Average: 18,007,868 shares |
| Shares Outstanding: 35.10 (millions) |
| Market Capitalization: $17.62 (millions) |
| Beta: 0.86 |
| 52 Week High: $1.79 |
| 52 Week Low: $0.38 |
| Short Interest Ratio: |
| |
% Price Change |
% Price Change Relative to S&P 500 |
| 4 Week |
-15.66% |
-19.78% |
| 12 Week |
19.52% |
10.49% |
| Year To Date |
-11.01% |
-16.86% |
|
|
|
|
| |
|
|
| |
| • General Corporate Information |
Officers
Kuk Hyoun Hwang - Chief Executive Officer and Director
Gihyoun Bang - Chief Financial Officer
Seng Chin Mah - Director
Hyuk Joo Jee - Director
Hyuk Joo Jee - Director
|
|
Peer Information
OSR Holdings, Inc. (CHCR)
OSR Holdings, Inc. (ESRX)
OSR Holdings, Inc. (MYDP)
OSR Holdings, Inc. (COR)
OSR Holdings, Inc. (GBCS)
OSR Holdings, Inc. (LAXAF)
|
|
Industry / Sector / Ticker Info
Analyst Coverage: No
Industry Group: Medical Services
Sector: Medical
CUSIP: 68840D102
SIC: 3841
|
|
Fiscal Year
Fiscal Year End: December
Last Reported Quarter: 03/01/26
Next Expected EPS Date: 08/13/26
|
|
Share - Related Items
Shares Outstanding: 35.10
Most Recent Split Date: (:1)
Beta: 0.86
Market Capitalization: $17.62 (millions)
|
|
|
|
|
| |
| • EPS Information |
• Dividend Information |
| Analyst Coverage: No |
Dividend Yield: 0.00% |
| Current Fiscal Quarter EPS Consensus Estimate: $ |
Indicated Annual Dividend: $0.00 |
| Current Fiscal Year EPS Consensus Estimate: $ |
Payout Ratio: |
| Number of Estimates in the Fiscal Year Consensus: |
Change In Payout Ratio: |
| Estmated Long-Term EPS Growth Rate: % |
Last Dividend Paid: NA - $0.00 |
| Next EPS Report Date: 08/13/26 |
|
|
|
| |