| Zacks Company Profile for PCB Bancorp (PCB : NSDQ) |
|
|
| |
| • Company Description |
| PCB Bancorp is a bank holding company which, through its subsidiaries, offers savings accounts, debit and credit cards, personal and business loans, cash management, certificate of deposits, online banking, mortgages, wealth management and e-statements. PCB Bancorp, formerly known as Pacific City Financial Corp, is based in Los Angeles, United States.
Number of Employees: 265 |
|
|
| |
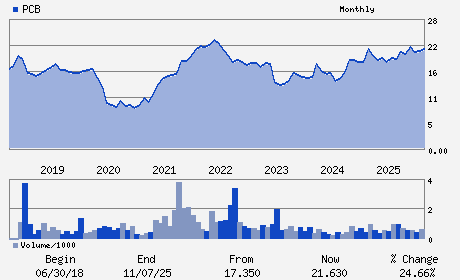
| • Price / Volume Information |
| Yesterday's Closing Price: $24.54 |
Daily Weekly Monthly
 |
| 20 Day Moving Average: 24,686 shares |
| Shares Outstanding: 14.23 (millions) |
| Market Capitalization: $349.33 (millions) |
| Beta: 0.53 |
| 52 Week High: $25.15 |
| 52 Week Low: $18.78 |
| Short Interest Ratio: |
| |
% Price Change |
% Price Change Relative to S&P 500 |
| 4 Week |
2.81% |
-2.22% |
| 12 Week |
7.26% |
-0.85% |
| Year To Date |
13.35% |
4.25% |
|
|
|
|
| |
| • Address & Contact Information |
| Street Address |
Phone / Fax |
Email Address |
Web URL |
3701 WILSHIRE BLVD SUITE 900
-
LOS ANGELES,CA 90010
USA |
ph: 213-210-2000
fax: 213-210-2032 |
None |
http://www.mypcbbank.com |
|
|
| |
| • General Corporate Information |
Officers
Henry Kim - Director; President and Chief Executive Officer
Sang Young Lee - Chairman of the Board of Directors
Timothy Chang - Senior Executive Vice President and Chief Financia
Kijun Ahn - Director
Daniel Cho - Director
|
|
Peer Information
PCB Bancorp (FBA)
PCB Bancorp (FVNB)
PCB Bancorp (FSNMQ)
PCB Bancorp (SRYPQ)
PCB Bancorp (BOKF)
PCB Bancorp (FHN)
|
|
Industry / Sector / Ticker Info
Analyst Coverage: No
Industry Group: BANKS-SOUTHWEST
Sector: Finance
CUSIP: 69320M109
SIC: 6022
|
|
Fiscal Year
Fiscal Year End: December
Last Reported Quarter: 03/01/26
Next Expected EPS Date: 07/23/26
|
|
Share - Related Items
Shares Outstanding: 14.23
Most Recent Split Date: (:1)
Beta: 0.53
Market Capitalization: $349.33 (millions)
|
|
|
|
|
| |
| • EPS Information |
• Dividend Information |
| Analyst Coverage: No |
Dividend Yield: 3.59% |
| Current Fiscal Quarter EPS Consensus Estimate: $0.73 |
Indicated Annual Dividend: $0.88 |
| Current Fiscal Year EPS Consensus Estimate: $2.94 |
Payout Ratio: 0.32 |
| Number of Estimates in the Fiscal Year Consensus: 2.00 |
Change In Payout Ratio: 0.01 |
| Estmated Long-Term EPS Growth Rate: % |
Last Dividend Paid: 05/08/2026 - $0.22 |
| Next EPS Report Date: 07/23/26 |
|
|
|
| |