| Zacks Company Profile for Phreesia, Inc. (PHR : NYSE) |
|
|
| |
| • Company Description |
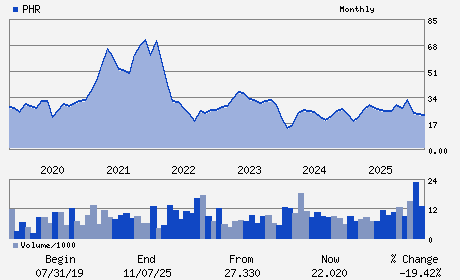
| Phreesia Inc. provides a patient intake management platform. The company's SaaS platform engages patients in their care and provides a modern, consistent experience, while enabling healthcare organizations to optimize their staffing, boost profitability and enhance clinical care. Phreesia Inc. is based in New York.
Number of Employees: 1,789 |
|
|
| |
| • Price / Volume Information |
| Yesterday's Closing Price: $8.92 |
Daily Weekly Monthly
 |
| 20 Day Moving Average: 1,320,107 shares |
| Shares Outstanding: 61.77 (millions) |
| Market Capitalization: $551.02 (millions) |
| Beta: 0.89 |
| 52 Week High: $32.76 |
| 52 Week Low: $7.77 |
| Short Interest Ratio: |
| |
% Price Change |
% Price Change Relative to S&P 500 |
| 4 Week |
0.79% |
-4.13% |
| 12 Week |
-27.66% |
-33.12% |
| Year To Date |
-47.28% |
-52.29% |
|
|
|
|
| |
|
|
| |
| • General Corporate Information |
Officers
Chaim Indig - Chief Executive Officer
Michael Weintraub - Chairman
Balaji Gandhi - Chief Financial Officer
Yvonne Hui - SVP; Principal Accounting Officer
Edward Cahill - Director
|
|
Peer Information
Phreesia, Inc. (HLIS)
Phreesia, Inc. (AZTA)
Phreesia, Inc. (APYI)
Phreesia, Inc. (RNVA)
Phreesia, Inc. (HMSY)
Phreesia, Inc. (LRSI)
|
|
Industry / Sector / Ticker Info
Analyst Coverage: No
Industry Group: MEDICAL INFO SYS
Sector: Medical
CUSIP: 71944F106
SIC: 7389
|
|
Fiscal Year
Fiscal Year End: January
Last Reported Quarter: 01/01/26
Next Expected EPS Date: 05/27/26
|
|
Share - Related Items
Shares Outstanding: 61.77
Most Recent Split Date: (:1)
Beta: 0.89
Market Capitalization: $551.02 (millions)
|
|
|
|
|
| |
| • EPS Information |
• Dividend Information |
| Analyst Coverage: No |
Dividend Yield: 0.00% |
| Current Fiscal Quarter EPS Consensus Estimate: $0.04 |
Indicated Annual Dividend: $0.00 |
| Current Fiscal Year EPS Consensus Estimate: $0.28 |
Payout Ratio: 0.00 |
| Number of Estimates in the Fiscal Year Consensus: 4.00 |
Change In Payout Ratio: |
| Estmated Long-Term EPS Growth Rate: % |
Last Dividend Paid: NA - $0.00 |
| Next EPS Report Date: 05/27/26 |
|
|
|
| |