| Zacks Company Profile for Polar Power, Inc. (POLA : NSDQ) |
|
|
| |
| • Company Description |
| Polar Power Inc. is engaged in designing, manufacturing and selling direct current power, systems and cooling systems for telecommunications, military, hybrid power station, DC marine and rapid charging electric vehicle. Its product portfolio includes DC generators, Marine DC generators, DC alternators, Li-ion batteries and generator accessories. Polar Power Inc. is headquatered in Gardena, California.
Number of Employees: 67 |
|
|
| |
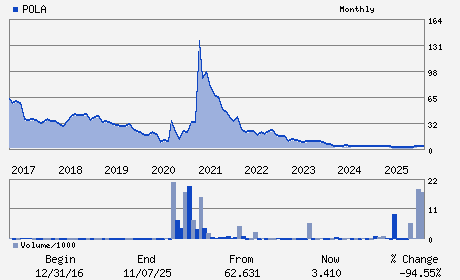
| • Price / Volume Information |
| Yesterday's Closing Price: $2.06 |
Daily Weekly Monthly
 |
| 20 Day Moving Average: 396,929 shares |
| Shares Outstanding: 3.64 (millions) |
| Market Capitalization: $7.50 (millions) |
| Beta: 1.13 |
| 52 Week High: $5.75 |
| 52 Week Low: $1.31 |
| Short Interest Ratio: |
| |
% Price Change |
% Price Change Relative to S&P 500 |
| 4 Week |
21.18% |
15.26% |
| 12 Week |
25.61% |
16.12% |
| Year To Date |
23.35% |
12.86% |
|
|
|
|
| |
|
|
| |
| • General Corporate Information |
Officers
Arthur D. Sams - Chief Executive Officer; President and Chairman
Luis Zavala - Chief Financial Officer
Keith Albrecht - Director
Katherine Koster - Director
Michael Field - Director
|
|
Peer Information
Polar Power, Inc. (ELP)
Polar Power, Inc. (CIV)
Polar Power, Inc. (ELPVY)
Polar Power, Inc. (HGKGY)
Polar Power, Inc. (AYE)
Polar Power, Inc. (GMP)
|
|
Industry / Sector / Ticker Info
Analyst Coverage: No
Industry Group: UTIL-ELEC PWR
Sector: Utilities
CUSIP: 73102V204
SIC: 3690
|
|
Fiscal Year
Fiscal Year End: December
Last Reported Quarter: 03/01/26
Next Expected EPS Date: 08/13/26
|
|
Share - Related Items
Shares Outstanding: 3.64
Most Recent Split Date: 11.00 (0.14:1)
Beta: 1.13
Market Capitalization: $7.50 (millions)
|
|
|
|
|
| |
| • EPS Information |
• Dividend Information |
| Analyst Coverage: No |
Dividend Yield: 0.00% |
| Current Fiscal Quarter EPS Consensus Estimate: $ |
Indicated Annual Dividend: $0.00 |
| Current Fiscal Year EPS Consensus Estimate: $ |
Payout Ratio: |
| Number of Estimates in the Fiscal Year Consensus: |
Change In Payout Ratio: |
| Estmated Long-Term EPS Growth Rate: % |
Last Dividend Paid: NA - $0.00 |
| Next EPS Report Date: 08/13/26 |
|
|
|
| |