| Zacks Company Profile for PPG Industries, Inc. (PPG : NYSE) |
|
|
| |
| • Company Description |
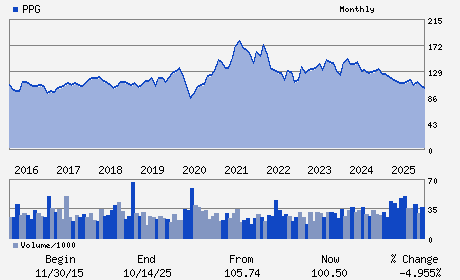
| PPG Industries Inc., based in Pennsylvania, is a global supplier of paints, coatings, chemicals, specialty materials, glass and fiber glass. The company has manufacturing facilities and equity affiliates in about 70 countries. It currently has three reportable segments: Global Architectural Coatings, Performance Coatings and Industrial Coatings.
Number of Employees: 43,500 |
|
|
| |
| • Price / Volume Information |
| Yesterday's Closing Price: $107.78 |
Daily Weekly Monthly
 |
| 20 Day Moving Average: 1,837,623 shares |
| Shares Outstanding: 222.90 (millions) |
| Market Capitalization: $24,024.16 (millions) |
| Beta: 1.06 |
| 52 Week High: $133.43 |
| 52 Week Low: $93.39 |
| Short Interest Ratio: |
| |
% Price Change |
% Price Change Relative to S&P 500 |
| 4 Week |
-2.28% |
-7.05% |
| 12 Week |
-12.71% |
-19.31% |
| Year To Date |
5.19% |
-4.32% |
|
|
|
|
| |
| • Address & Contact Information |
| Street Address |
Phone / Fax |
Email Address |
Web URL |
ONE PPG PLACE
-
PITTSBURGH,PA 15272
USA |
ph: 412-434-3131
fax: 412-434-2011 |
investor@ppg.com |
http://www.ppg.com |
|
|
| |
| • General Corporate Information |
Officers
Timothy M. Knavish - Chairman and Chief Executive Officer
Vincent J. Morales - Senior Vice President and Chief Financial Officer
Brian R. Williams - Vice President and Controller
K. L. Fortmann - Director
M. L. Healey - Director
|
|
Peer Information
PPG Industries, Inc. (CSBHY)
PPG Industries, Inc. (ARWM)
PPG Industries, Inc. (FUL)
PPG Industries, Inc. (IAX)
PPG Industries, Inc. (AVD)
PPG Industries, Inc. (ASH)
|
|
Industry / Sector / Ticker Info
Analyst Coverage: No
Industry Group: CHEM-SPECIALTY
Sector: Basic Materials
CUSIP: 693506107
SIC: 2851
|
|
Fiscal Year
Fiscal Year End: December
Last Reported Quarter: 03/01/26
Next Expected EPS Date: 08/04/26
|
|
Share - Related Items
Shares Outstanding: 222.90
Most Recent Split Date: 6.00 (2.00:1)
Beta: 1.06
Market Capitalization: $24,024.16 (millions)
|
|
|
|
|
| |
| • EPS Information |
• Dividend Information |
| Analyst Coverage: No |
Dividend Yield: 2.63% |
| Current Fiscal Quarter EPS Consensus Estimate: $2.25 |
Indicated Annual Dividend: $2.84 |
| Current Fiscal Year EPS Consensus Estimate: $7.93 |
Payout Ratio: 0.37 |
| Number of Estimates in the Fiscal Year Consensus: 9.00 |
Change In Payout Ratio: 0.01 |
| Estmated Long-Term EPS Growth Rate: 8.64% |
Last Dividend Paid: 05/11/2026 - $1.42 |
| Next EPS Report Date: 08/04/26 |
|
|
|
| |