| Zacks Company Profile for Procaps Group, S.A. (PROCF : OTC) |
|
|
| |
| • Company Description |
| Procaps Group is a developer of pharmaceutical and nutraceutical solutions, medicines and hospital supplies. It develops, manufactures and markets over-the-counter and prescription drugs, nutritional supplements and high-potency clinical solutions. Procaps Group, formerly known as Union Acquisition Corp. II, is based in BARRANQUILLA, Colombia.
Number of Employees: 4,500 |
|
|
| |
| • Price / Volume Information |
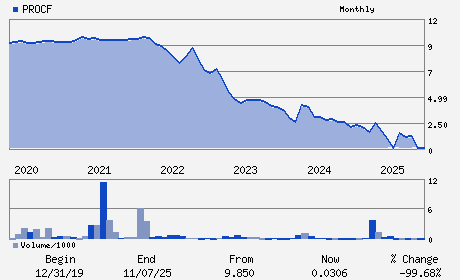
| Yesterday's Closing Price: $0.03 |
Daily Weekly Monthly
 |
| 20 Day Moving Average: 318 shares |
| Shares Outstanding: 2,303.86 (millions) |
| Market Capitalization: $57.60 (millions) |
| Beta: 56.96 |
| 52 Week High: $1.45 |
| 52 Week Low: $0.00 |
| Short Interest Ratio: |
| |
% Price Change |
% Price Change Relative to S&P 500 |
| 4 Week |
-0.42% |
-5.27% |
| 12 Week |
3.33% |
-4.52% |
| Year To Date |
-0.42% |
-98.90% |
|
|
|
|
| |
|
|
| |
| • General Corporate Information |
Officers
Ruben Minski - Chief Executive Officer
Alejandro E. Weinstein - Chairman
Camilo Camacho - Chief Operations Officer
Daniel Bernal - Chief Financial Officer
Mauricio Castaneda Caballero - Vice-President
|
|
Peer Information
Procaps Group, S.A. (GSAC)
Procaps Group, S.A. (CASIF)
Procaps Group, S.A. (ALCD.)
Procaps Group, S.A. (OMNN)
Procaps Group, S.A. (CGPI.)
Procaps Group, S.A. (CATX)
|
|
Industry / Sector / Ticker Info
Analyst Coverage: No
Industry Group: MED-DRUGS
Sector: Medical
CUSIP: L7756P102
SIC: 2834
|
|
Fiscal Year
Fiscal Year End: December
Last Reported Quarter: -
Next Expected EPS Date: -
|
|
Share - Related Items
Shares Outstanding: 2,303.86
Most Recent Split Date: (:1)
Beta: 56.96
Market Capitalization: $57.60 (millions)
|
|
|
|
|
| |
| • EPS Information |
• Dividend Information |
| Analyst Coverage: No |
Dividend Yield: 0.00% |
| Current Fiscal Quarter EPS Consensus Estimate: $ |
Indicated Annual Dividend: $0.00 |
| Current Fiscal Year EPS Consensus Estimate: $ |
Payout Ratio: |
| Number of Estimates in the Fiscal Year Consensus: |
Change In Payout Ratio: |
| Estmated Long-Term EPS Growth Rate: % |
Last Dividend Paid: NA - $0.00 |
| Next EPS Report Date: - |
|
|
|
| |