| Zacks Company Profile for PTC Therapeutics, Inc. (PTCT : NSDQ) |
|
|
| |
| • Company Description |
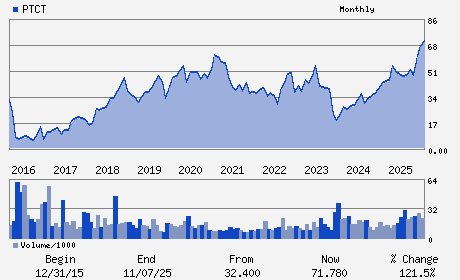
| PTC Therapeutics, Inc. is a biopharmaceutical company. It is focused on the discovery and development of orally administered, small-molecule drugs for genetic disorders, oncology and infectious disease. PTC Therapeutics, Inc. is based in South Plainfield, United States.
Number of Employees: 991 |
|
|
| |
| • Price / Volume Information |
| Yesterday's Closing Price: $68.81 |
Daily Weekly Monthly
 |
| 20 Day Moving Average: 1,579,399 shares |
| Shares Outstanding: 82.95 (millions) |
| Market Capitalization: $5,707.72 (millions) |
| Beta: 0.53 |
| 52 Week High: $87.50 |
| 52 Week Low: $43.18 |
| Short Interest Ratio: |
| |
% Price Change |
% Price Change Relative to S&P 500 |
| 4 Week |
0.32% |
-4.58% |
| 12 Week |
1.04% |
-6.59% |
| Year To Date |
-9.41% |
-15.53% |
|
|
|
|
| |
| • Address & Contact Information |
| Street Address |
Phone / Fax |
Email Address |
Web URL |
500 WARREN CORPORATE CENTER DRIVE
-
WARREN,NJ 07059
USA |
ph: 908-222-7000
fax: 908-222-7231 |
ecavaleri@ptcbio.com |
http://www.ptcbio.com |
|
|
| |
| • General Corporate Information |
Officers
Matthew B. Klein - Chief Executive Officer and Director
Pierre Gravier - Chief Financial Officer
Christine Utter - Chief Accounting Officer
Michael Schmertzler - Director
Allan Jacobson - Director
|
|
Peer Information
PTC Therapeutics, Inc. (CORR.)
PTC Therapeutics, Inc. (RSPI)
PTC Therapeutics, Inc. (CGXP)
PTC Therapeutics, Inc. (BGEN)
PTC Therapeutics, Inc. (GTBP)
PTC Therapeutics, Inc. (RGRX)
|
|
Industry / Sector / Ticker Info
Analyst Coverage: No
Industry Group: MED-BIOMED/GENE
Sector: Medical
CUSIP: 69366J200
SIC: 2834
|
|
Fiscal Year
Fiscal Year End: December
Last Reported Quarter: 03/01/26
Next Expected EPS Date: 08/06/26
|
|
Share - Related Items
Shares Outstanding: 82.95
Most Recent Split Date: (:1)
Beta: 0.53
Market Capitalization: $5,707.72 (millions)
|
|
|
|
|
| |
| • EPS Information |
• Dividend Information |
| Analyst Coverage: No |
Dividend Yield: 0.00% |
| Current Fiscal Quarter EPS Consensus Estimate: $-0.07 |
Indicated Annual Dividend: $0.00 |
| Current Fiscal Year EPS Consensus Estimate: $0.19 |
Payout Ratio: 0.00 |
| Number of Estimates in the Fiscal Year Consensus: 9.00 |
Change In Payout Ratio: |
| Estmated Long-Term EPS Growth Rate: 27.74% |
Last Dividend Paid: NA - $0.00 |
| Next EPS Report Date: 08/06/26 |
|
|
|
| |