| Zacks Company Profile for Rocky Brands, Inc. (RCKY : NSDQ) |
|
|
| |
| • Company Description |
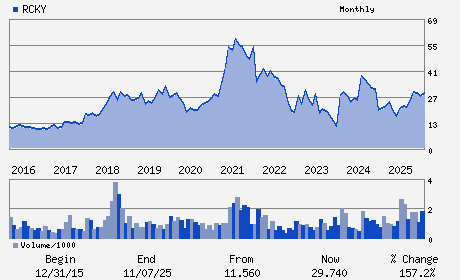
| Rocky Brands, Inc. is a leading designer, manufacturer and marketer of premium quality footwear and apparel marketed under a portfolio of well recognized brand names including Rocky Outdoor Gear, Georgia Boot, Durango, Lehigh, and the licensed brand, Dickies.
Number of Employees: 2,200 |
|
|
| |
| • Price / Volume Information |
| Yesterday's Closing Price: $42.08 |
Daily Weekly Monthly
 |
| 20 Day Moving Average: 46,290 shares |
| Shares Outstanding: 7.54 (millions) |
| Market Capitalization: $317.14 (millions) |
| Beta: 2.58 |
| 52 Week High: $48.70 |
| 52 Week Low: $12.31 |
| Short Interest Ratio: |
| |
% Price Change |
% Price Change Relative to S&P 500 |
| 4 Week |
1.08% |
-4.65% |
| 12 Week |
25.27% |
22.65% |
| Year To Date |
43.47% |
39.85% |
|
|
|
|
| |
| • Address & Contact Information |
| Street Address |
Phone / Fax |
Email Address |
Web URL |
39 EAST CANAL STREET
-
NELSONVILLE,OH 45764
USA |
ph: 740-753-1951
fax: 740-753-4024 |
None |
http://www.rockybrands.com |
|
|
| |
| • General Corporate Information |
Officers
Jason S. Brooks - Chief Executive Officer; Chairman and President
Thomas D. Robertson - Chief Financial Officer; Chief Operating Officer a
Michael L. Finn - Director
Robyn R. Hahn - Director
G. Courtney Haning - Director
|
|
Peer Information
Rocky Brands, Inc. (RCSFY)
Rocky Brands, Inc. (BIRK)
Rocky Brands, Inc. (SRR)
Rocky Brands, Inc. (TBL)
Rocky Brands, Inc. (SHOO)
Rocky Brands, Inc. (DFZ)
|
|
Industry / Sector / Ticker Info
Analyst Coverage: No
Industry Group: SHOES&REL APPRL
Sector: Consumer Discretionary
CUSIP: 774515100
SIC: 3140
|
|
Fiscal Year
Fiscal Year End: December
Last Reported Quarter: 12/01/25
Next Expected EPS Date: 05/05/26
|
|
Share - Related Items
Shares Outstanding: 7.54
Most Recent Split Date: (:1)
Beta: 2.58
Market Capitalization: $317.14 (millions)
|
|
|
|
|
| |
| • EPS Information |
• Dividend Information |
| Analyst Coverage: No |
Dividend Yield: 1.47% |
| Current Fiscal Quarter EPS Consensus Estimate: $ |
Indicated Annual Dividend: $0.62 |
| Current Fiscal Year EPS Consensus Estimate: $ |
Payout Ratio: 0.19 |
| Number of Estimates in the Fiscal Year Consensus: |
Change In Payout Ratio: -0.02 |
| Estmated Long-Term EPS Growth Rate: % |
Last Dividend Paid: 03/02/2026 - $0.16 |
| Next EPS Report Date: 05/05/26 |
|
|
|
| |