| Zacks Company Profile for Rush Enterprises, Inc. (RUSHA : NSDQ) |
|
|
| |
| • Company Description |
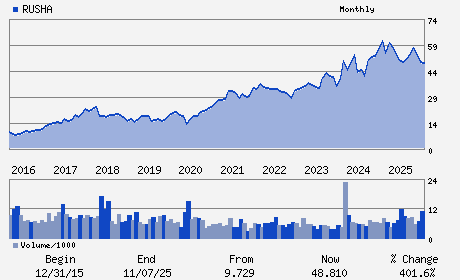
| Rush Enterprises operates the largest network of Peterbilt heavy-duty truck dealerships in North America and John Deere construction equipment dealerships in Texas and Michigan. Their current operations include a network of dealerships located in Texas, California, Oklahoma, Louisiana, Colorado, Arizona, New Mexico and Michigan. These dealerships provide an integrated, one-stop source for the retail sale of new and used heavy-duty trucks and construction equipment; aftermarket parts, service and body shop facilities; and a wide array of financial services.
Number of Employees: 7,355 |
|
|
| |
| • Price / Volume Information |
| Yesterday's Closing Price: $69.96 |
Daily Weekly Monthly
 |
| 20 Day Moving Average: 419,626 shares |
| Shares Outstanding: 76.94 (millions) |
| Market Capitalization: $5,382.81 (millions) |
| Beta: 0.89 |
| 52 Week High: $75.99 |
| 52 Week Low: $45.67 |
| Short Interest Ratio: |
| |
% Price Change |
% Price Change Relative to S&P 500 |
| 4 Week |
10.35% |
4.09% |
| 12 Week |
8.10% |
5.83% |
| Year To Date |
29.70% |
26.42% |
|
|
|
|
| |
|
|
| |
| • General Corporate Information |
Officers
W. M. Rusty Rush - Chief Executive Officer; President and Chairman
Jason Wilder - Chief Operating Officer
Steven L. Keller - Chief Financial Officer and Treasurer
Thomas A. Akin - Director
Raymond J. Chess - Director
|
|
Peer Information
Rush Enterprises, Inc. (RVEE)
Rush Enterprises, Inc. (WKSP)
Rush Enterprises, Inc. (CRMT)
Rush Enterprises, Inc. (ACCA)
Rush Enterprises, Inc. (UGLY)
Rush Enterprises, Inc. (LAD)
|
|
Industry / Sector / Ticker Info
Analyst Coverage: No
Industry Group: RET/WHLSL AUTO/TRUCK
Sector: Retail/Wholesale
CUSIP: 781846209
SIC: 5500
|
|
Fiscal Year
Fiscal Year End: December
Last Reported Quarter: 12/01/25
Next Expected EPS Date: 04/28/26
|
|
Share - Related Items
Shares Outstanding: 76.94
Most Recent Split Date: 8.00 (1.50:1)
Beta: 0.89
Market Capitalization: $5,382.81 (millions)
|
|
|
|
|
| |
| • EPS Information |
• Dividend Information |
| Analyst Coverage: No |
Dividend Yield: 1.09% |
| Current Fiscal Quarter EPS Consensus Estimate: $ |
Indicated Annual Dividend: $0.76 |
| Current Fiscal Year EPS Consensus Estimate: $3.81 |
Payout Ratio: 0.23 |
| Number of Estimates in the Fiscal Year Consensus: 1.00 |
Change In Payout Ratio: 0.05 |
| Estmated Long-Term EPS Growth Rate: 13.25% |
Last Dividend Paid: 03/03/2026 - $0.19 |
| Next EPS Report Date: 04/28/26 |
|
|
|
| |