| Zacks Company Profile for SentinelOne, Inc. (S : NYSE) |
|
|
| |
| • Company Description |
| SentinelOne Inc. provides an autonomous cybersecurity platform. It offer cybersecurity solutions encompass AI-powered prevention, detection, response and hunting across endpoints, containers, cloud workloads and IoT devices in a single autonomous XDR platform. SentinelOne Inc. is based in MOUNTAIN VIEW, Calif.
Number of Employees: 2,900 |
|
|
| |
| • Price / Volume Information |
| Yesterday's Closing Price: $19.44 |
Daily Weekly Monthly
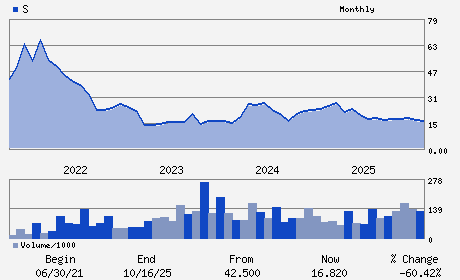 |
| 20 Day Moving Average: 8,041,479 shares |
| Shares Outstanding: 348.05 (millions) |
| Market Capitalization: $6,766.08 (millions) |
| Beta: 0.77 |
| 52 Week High: $23.95 |
| 52 Week Low: $11.81 |
| Short Interest Ratio: |
| |
% Price Change |
% Price Change Relative to S&P 500 |
| 4 Week |
-12.82% |
-11.55% |
| 12 Week |
31.35% |
27.63% |
| Year To Date |
29.60% |
16.18% |
|
|
|
|
| |
|
|
| |
| • General Corporate Information |
Officers
Tomer Weingarten - Chairman; President; and Chief Executive Officer
Barry Padgett - Chief Financial Officer
Robin Tomasello - Chief Accounting Officer
Mark J. Barrenechea - Director
Charlene T. Begley - Director
|
|
Peer Information
SentinelOne, Inc. (CHKP)
SentinelOne, Inc. (ABST)
SentinelOne, Inc. (ZIXI)
SentinelOne, Inc. (FTNT)
SentinelOne, Inc. (GUID)
SentinelOne, Inc. (VRNS)
|
|
Industry / Sector / Ticker Info
Analyst Coverage: No
Industry Group: Security
Sector: Computer and Technology
CUSIP: 81730H109
SIC: 7372
|
|
Fiscal Year
Fiscal Year End: January
Last Reported Quarter: 07/01/26
Next Expected EPS Date: 12/03/26
|
|
Share - Related Items
Shares Outstanding: 348.05
Most Recent Split Date: (:1)
Beta: 0.77
Market Capitalization: $6,766.08 (millions)
|
|
|
|
|
| |
| • EPS Information |
• Dividend Information |
| Analyst Coverage: No |
Dividend Yield: 0.00% |
| Current Fiscal Quarter EPS Consensus Estimate: $-0.11 |
Indicated Annual Dividend: $0.00 |
| Current Fiscal Year EPS Consensus Estimate: $-0.45 |
Payout Ratio: |
| Number of Estimates in the Fiscal Year Consensus: 13.00 |
Change In Payout Ratio: |
| Estmated Long-Term EPS Growth Rate: 46.19% |
Last Dividend Paid: NA - $0.00 |
| Next EPS Report Date: 12/03/26 |
|
|
|
| |

