| Zacks Company Profile for SAB Biotherapeutics, Inc. (SABS : NSDQ) |
|
|
| |
| • Company Description |
| SAB Biotherapeutics Inc. is a clinical-stage biopharmaceutical company advancing a new class of immunotherapies leveraging fully human polyclonal antibodies. It produces natural, specifically targeted, high-potency, human polyclonal immunotherapies. SAB Biotherapeutics Inc., formerly known as Big Cypress Acquisition Corp., is based in SIOUX FALLS, S.D.
Number of Employees: 86 |
|
|
| |
| • Price / Volume Information |
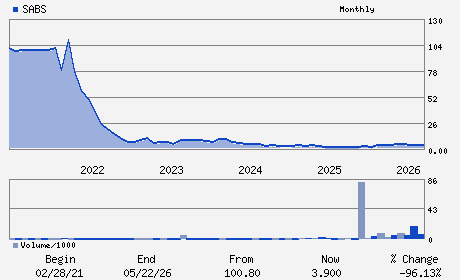
| Yesterday's Closing Price: $3.90 |
Daily Weekly Monthly
 |
| 20 Day Moving Average: 1,097,378 shares |
| Shares Outstanding: 76.46 (millions) |
| Market Capitalization: $298.21 (millions) |
| Beta: 0.55 |
| 52 Week High: $5.15 |
| 52 Week Low: $1.60 |
| Short Interest Ratio: |
| |
% Price Change |
% Price Change Relative to S&P 500 |
| 4 Week |
2.63% |
-2.38% |
| 12 Week |
-5.57% |
-12.70% |
| Year To Date |
4.28% |
-6.34% |
|
|
|
|
| |
|
|
| |
| • General Corporate Information |
Officers
Samuel J. Reich - Chief Executive Officer and Director
David Zaccardelli - Chairman of the Board
Eddie J. Sullivan - President and Director
Christoph Bausch - Chief Operating Officer
Lucy To - Chief Financial Officer
|
|
Peer Information
SAB Biotherapeutics, Inc. (CORR.)
SAB Biotherapeutics, Inc. (RSPI)
SAB Biotherapeutics, Inc. (CGXP)
SAB Biotherapeutics, Inc. (BGEN)
SAB Biotherapeutics, Inc. (GTBP)
SAB Biotherapeutics, Inc. (RGRX)
|
|
Industry / Sector / Ticker Info
Analyst Coverage: No
Industry Group: MED-BIOMED/GENE
Sector: Medical
CUSIP: 78397T202
SIC: 2836
|
|
Fiscal Year
Fiscal Year End: December
Last Reported Quarter: 03/01/26
Next Expected EPS Date: 08/06/26
|
|
Share - Related Items
Shares Outstanding: 76.46
Most Recent Split Date: 1.00 (0.10:1)
Beta: 0.55
Market Capitalization: $298.21 (millions)
|
|
|
|
|
| |
| • EPS Information |
• Dividend Information |
| Analyst Coverage: No |
Dividend Yield: 0.00% |
| Current Fiscal Quarter EPS Consensus Estimate: $-0.29 |
Indicated Annual Dividend: $0.00 |
| Current Fiscal Year EPS Consensus Estimate: $-1.18 |
Payout Ratio: |
| Number of Estimates in the Fiscal Year Consensus: 4.00 |
Change In Payout Ratio: |
| Estmated Long-Term EPS Growth Rate: % |
Last Dividend Paid: NA - $0.00 |
| Next EPS Report Date: 08/06/26 |
|
|
|
| |