| Zacks Company Profile for Sally Beauty Holdings, Inc. (SBH : NYSE) |
|
|
| |
| • Company Description |
| Sally Beauty Holdings, Inc. is an international specialty retailer and distributor of professional beauty supplies in the U.S. Products of the company include hair color and care products, styling tools, skin and nail care products and other beauty items along with ethnic beauty products. Store personnel also provide beauty insights and solutions. This also includes franchised units that have operations throughout the United States and Puerto Rico, the U.K., Chile, Belgium, Canada, Mexico, Spain, Germany, France, Ireland, the Netherlands, and Peru. Sally Beauty stores offer a wide array of products for hair, skin and nails through professional lines. It has 2 segments: Sally Beauty Supply (SBS) and Beauty Systems Group (BSG). The BSG unit provides products mainly to salons and salon professionals. BSG stores offer an extensive range of third party branded beauty products. The SBS unit mainly caters to retail consumer along with salons and salon professionals.
Number of Employees: 27,000 |
|
|
| |
| • Price / Volume Information |
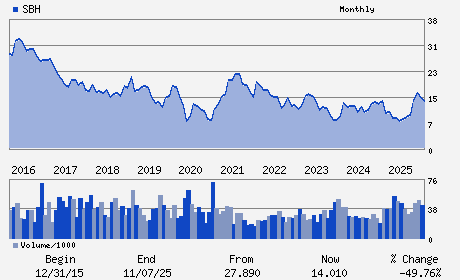
| Yesterday's Closing Price: $13.79 |
Daily Weekly Monthly
 |
| 20 Day Moving Average: 1,396,252 shares |
| Shares Outstanding: 97.01 (millions) |
| Market Capitalization: $1,337.75 (millions) |
| Beta: 1.12 |
| 52 Week High: $17.92 |
| 52 Week Low: $7.65 |
| Short Interest Ratio: |
| |
% Price Change |
% Price Change Relative to S&P 500 |
| 4 Week |
2.00% |
-3.79% |
| 12 Week |
-14.13% |
-15.94% |
| Year To Date |
-3.30% |
-5.74% |
|
|
|
|
| |
|
|
| |
| • General Corporate Information |
Officers
Denise Paulonis - Chief Executive Officer; President and Director
Diana S. Ferguson - Chairman
Marlo M. Cormier - Senior Vice President; Chief Financial Officer
Rachel R. Bishop - Director
Jeffrey Boyer - Director
|
|
Peer Information
Sally Beauty Holdings, Inc. (COCQ)
Sally Beauty Holdings, Inc. (JAS)
Sally Beauty Holdings, Inc. (JAS.B)
Sally Beauty Holdings, Inc. (HKFIQ)
Sally Beauty Holdings, Inc. (CNJ)
Sally Beauty Holdings, Inc. (T.CTC)
|
|
Industry / Sector / Ticker Info
Analyst Coverage: No
Industry Group: RETAIL-MISC/DIV
Sector: Retail/Wholesale
CUSIP: 79546E104
SIC: 5990
|
|
Fiscal Year
Fiscal Year End: September
Last Reported Quarter: 12/01/25
Next Expected EPS Date: 05/11/26
|
|
Share - Related Items
Shares Outstanding: 97.01
Most Recent Split Date: (:1)
Beta: 1.12
Market Capitalization: $1,337.75 (millions)
|
|
|
|
|
| |
| • EPS Information |
• Dividend Information |
| Analyst Coverage: No |
Dividend Yield: 0.00% |
| Current Fiscal Quarter EPS Consensus Estimate: $0.57 |
Indicated Annual Dividend: $0.00 |
| Current Fiscal Year EPS Consensus Estimate: $2.07 |
Payout Ratio: 0.00 |
| Number of Estimates in the Fiscal Year Consensus: 3.00 |
Change In Payout Ratio: 0.00 |
| Estmated Long-Term EPS Growth Rate: % |
Last Dividend Paid: NA - $0.00 |
| Next EPS Report Date: 05/11/26 |
|
|
|
| |