| Zacks Company Profile for Solaris Energy Infrastructure, Inc. (SEI : NYSE) |
|
|
| |
| • Company Description |
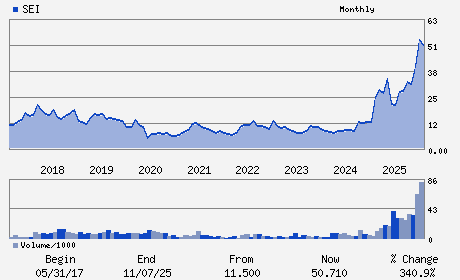
| Solaris Energy Infrastructure Inc. provides mobile and scalable equipment-based solutions for use in distributed power generation as well as the management of raw materials used in the completion of oil and natural gas wells. The company serves energy, data centers and other commercial and industrial sectors. Solaris Energy Infrastructure Inc., formerly known as Solaris Oilfield Infrastructure Inc., is based in HOUSTON.
Number of Employees: 468 |
|
|
| |
| • Price / Volume Information |
| Yesterday's Closing Price: $72.41 |
Daily Weekly Monthly
 |
| 20 Day Moving Average: 2,065,214 shares |
| Shares Outstanding: 68.47 (millions) |
| Market Capitalization: $4,957.67 (millions) |
| Beta: 1.05 |
| 52 Week High: $72.02 |
| 52 Week Low: $19.05 |
| Short Interest Ratio: |
| |
% Price Change |
% Price Change Relative to S&P 500 |
| 4 Week |
25.21% |
11.30% |
| 12 Week |
31.20% |
27.06% |
| Year To Date |
57.52% |
50.49% |
|
|
|
|
| |
|
|
| |
| • General Corporate Information |
Officers
William A. Zartler - Chairman and Co-Chief Executive Officer
Amanda M. Brock - Co-Chief Executive Officer and Director
Stephan E. Tompsett - Chief Financial Officer
Christopher P. Wirtz - Chief Accounting Officer
James R. Burke - Director
|
|
Peer Information
Solaris Energy Infrastructure, Inc. (WFTIQ)
Solaris Energy Infrastructure, Inc. (KGS)
Solaris Energy Infrastructure, Inc. (CAM.1)
Solaris Energy Infrastructure, Inc. (PGEO)
Solaris Energy Infrastructure, Inc. (UFAB.)
Solaris Energy Infrastructure, Inc. (POWR.)
|
|
Industry / Sector / Ticker Info
Analyst Coverage: No
Industry Group: OIL FLD MCH&EQP
Sector: Oils/Energy
CUSIP: 83418M103
SIC: 3533
|
|
Fiscal Year
Fiscal Year End: December
Last Reported Quarter: 12/01/25
Next Expected EPS Date: 04/27/26
|
|
Share - Related Items
Shares Outstanding: 68.47
Most Recent Split Date: (:1)
Beta: 1.05
Market Capitalization: $4,957.67 (millions)
|
|
|
|
|
| |
| • EPS Information |
• Dividend Information |
| Analyst Coverage: No |
Dividend Yield: 0.66% |
| Current Fiscal Quarter EPS Consensus Estimate: $0.24 |
Indicated Annual Dividend: $0.48 |
| Current Fiscal Year EPS Consensus Estimate: $1.37 |
Payout Ratio: 0.40 |
| Number of Estimates in the Fiscal Year Consensus: 5.00 |
Change In Payout Ratio: -0.54 |
| Estmated Long-Term EPS Growth Rate: % |
Last Dividend Paid: 03/10/2026 - $0.12 |
| Next EPS Report Date: 04/27/26 |
|
|
|
| |