| Zacks Company Profile for Slide Insurance Holdings, Inc. (SLDE : NSDQ) |
|
|
| |
| • Company Description |
| Slide Insurance Holdings Inc. engages in underwriting single family and condominium policies in the property and casualty industry principally in the United States. It writes coastal specialty personal lines insurance, including homeowners, condominium unit owners, commercial residential and other products as well as reinsurance products. Slide Insurance Holdings Inc. is based in Tampa, Florida.
Number of Employees: 504 |
|
|
| |
| • Price / Volume Information |
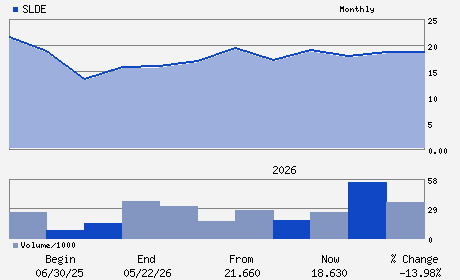
| Yesterday's Closing Price: $18.63 |
Daily Weekly Monthly
 |
| 20 Day Moving Average: 1,694,064 shares |
| Shares Outstanding: 114.56 (millions) |
| Market Capitalization: $2,134.23 (millions) |
| Beta: |
| 52 Week High: $25.90 |
| 52 Week Low: $12.53 |
| Short Interest Ratio: |
| |
% Price Change |
% Price Change Relative to S&P 500 |
| 4 Week |
2.25% |
-2.74% |
| 12 Week |
-4.71% |
-11.91% |
| Year To Date |
-4.36% |
-12.17% |
|
|
|
|
| |
|
|
| |
| • General Corporate Information |
Officers
Bruce Lucas - Chief Executive Officer and Chairman
Shannon Lucas - President and Chief Operating Officer
Anastasios Omiridis - Chief Financial Officer
Robert Gries - Director
Thomas O`Shea - Director
|
|
Peer Information
Slide Insurance Holdings, Inc. (RDN)
Slide Insurance Holdings, Inc. (AIG)
Slide Insurance Holdings, Inc. (ACGI)
Slide Insurance Holdings, Inc. (TXSC)
Slide Insurance Holdings, Inc. (PTVCB)
Slide Insurance Holdings, Inc. (PTVCA)
|
|
Industry / Sector / Ticker Info
Analyst Coverage: No
Industry Group: INS-MULTI LINE
Sector: Finance
CUSIP: 831349105
SIC: 6331
|
|
Fiscal Year
Fiscal Year End: December
Last Reported Quarter: 03/01/26
Next Expected EPS Date: 08/11/26
|
|
Share - Related Items
Shares Outstanding: 114.56
Most Recent Split Date: (:1)
Beta:
Market Capitalization: $2,134.23 (millions)
|
|
|
|
|
| |
| • EPS Information |
• Dividend Information |
| Analyst Coverage: No |
Dividend Yield: 0.00% |
| Current Fiscal Quarter EPS Consensus Estimate: $0.75 |
Indicated Annual Dividend: $0.00 |
| Current Fiscal Year EPS Consensus Estimate: $3.51 |
Payout Ratio: 0.00 |
| Number of Estimates in the Fiscal Year Consensus: 2.00 |
Change In Payout Ratio: |
| Estmated Long-Term EPS Growth Rate: % |
Last Dividend Paid: NA - $0.00 |
| Next EPS Report Date: 08/11/26 |
|
|
|
| |