| Zacks Company Profile for SharkNinja, Inc. (SN : NYSE) |
|
|
| |
| • Company Description |
| SharkNinja Inc. is a diversified, product design and technology company which creates lifestyle solutions through products for consumers. The Company's products are sold at key retailers, online and offline and through distributors. SharkNinja Inc. is based in NEEDHAM, Mass.
Number of Employees: 4,143 |
|
|
| |
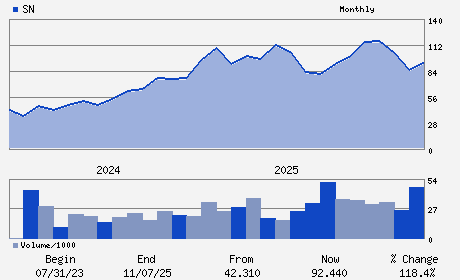
| • Price / Volume Information |
| Yesterday's Closing Price: $115.51 |
Daily Weekly Monthly
 |
| 20 Day Moving Average: 1,959,062 shares |
| Shares Outstanding: 141.24 (millions) |
| Market Capitalization: $16,314.96 (millions) |
| Beta: 1.54 |
| 52 Week High: $133.99 |
| 52 Week Low: $69.19 |
| Short Interest Ratio: |
| |
% Price Change |
% Price Change Relative to S&P 500 |
| 4 Week |
12.52% |
6.14% |
| 12 Week |
-6.21% |
-8.18% |
| Year To Date |
3.23% |
0.62% |
|
|
|
|
| |
|
|
| |
| • General Corporate Information |
Officers
Mark Barrocas - Chief Executive Officer; Director
Adam Quigley - Chief Financial Officer
Kaitlin Folan - Chief Accounting Officer
CJ Xuning Wang - Director
Kathryn J. Barton - Director
|
|
Peer Information
SharkNinja, Inc. (LENXQ)
SharkNinja, Inc. (BFXXQ)
SharkNinja, Inc. (CENT)
SharkNinja, Inc. (FTDL)
SharkNinja, Inc. (BTH)
SharkNinja, Inc. (JAH)
|
|
Industry / Sector / Ticker Info
Analyst Coverage: No
Industry Group: CONSM PD-MISC DIS
Sector: Consumer Discretionary
CUSIP: G8068L108
SIC: 3630
|
|
Fiscal Year
Fiscal Year End: December
Last Reported Quarter: 12/01/25
Next Expected EPS Date: 05/06/26
|
|
Share - Related Items
Shares Outstanding: 141.24
Most Recent Split Date: (:1)
Beta: 1.54
Market Capitalization: $16,314.96 (millions)
|
|
|
|
|
| |
| • EPS Information |
• Dividend Information |
| Analyst Coverage: No |
Dividend Yield: 0.00% |
| Current Fiscal Quarter EPS Consensus Estimate: $1.06 |
Indicated Annual Dividend: $0.00 |
| Current Fiscal Year EPS Consensus Estimate: $5.76 |
Payout Ratio: 0.00 |
| Number of Estimates in the Fiscal Year Consensus: 5.00 |
Change In Payout Ratio: |
| Estmated Long-Term EPS Growth Rate: 12.99% |
Last Dividend Paid: NA - $0.00 |
| Next EPS Report Date: 05/06/26 |
|
|
|
| |