| Zacks Company Profile for Stellar Bancorp, Inc. (STEL : NYSE) |
|
|
| |
| • Company Description |
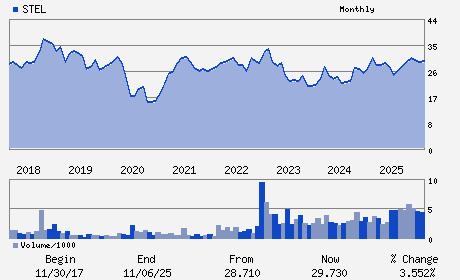
| Stellar Bancorp Inc. is a bank holding company. Its principal banking subsidiary, created by the merger of Allegiance Bank and Community Bank of Texas. The company provides a diversified range of commercial banking services primarily to small- to medium-sized businesses and individual customers. Stellar Bancorp Inc., formerly known as CBTX Inc., is based in HOUSTON.
Number of Employees: 1,053 |
|
|
| |
| • Price / Volume Information |
| Yesterday's Closing Price: $37.47 |
Daily Weekly Monthly
 |
| 20 Day Moving Average: 234,812 shares |
| Shares Outstanding: 50.92 (millions) |
| Market Capitalization: $1,908.01 (millions) |
| Beta: 0.72 |
| 52 Week High: $40.21 |
| 52 Week Low: $26.08 |
| Short Interest Ratio: |
| |
% Price Change |
% Price Change Relative to S&P 500 |
| 4 Week |
-0.24% |
-5.11% |
| 12 Week |
-2.62% |
-9.98% |
| Year To Date |
21.10% |
11.16% |
|
|
|
|
| |
| • Address & Contact Information |
| Street Address |
Phone / Fax |
Email Address |
Web URL |
9 GREENWAY PLAZA SUITE 110
-
HOUSTON,TX 77046
USA |
ph: 713-210-7600
fax: - |
ir@stellar.bank |
http://www.stellar.bank |
|
|
| |
| • General Corporate Information |
Officers
Robert R. Franklin, Jr. - Chief Executive Officer and Director
Paul P. Egge - Chief Financial Officer
Laura Bellows - Director
John Beckworth - Director
Cynthia Dopjera - Director
|
|
Peer Information
Stellar Bancorp, Inc. (TSFG)
Stellar Bancorp, Inc. (ABCB)
Stellar Bancorp, Inc. (CFNL)
Stellar Bancorp, Inc. (CPKF)
Stellar Bancorp, Inc. (HIB)
Stellar Bancorp, Inc. (FVB)
|
|
Industry / Sector / Ticker Info
Analyst Coverage: No
Industry Group: BANKS-SOUTHEAST
Sector: Finance
CUSIP: 858927106
SIC: 6021
|
|
Fiscal Year
Fiscal Year End: December
Last Reported Quarter: 03/01/26
Next Expected EPS Date: 07/24/26
|
|
Share - Related Items
Shares Outstanding: 50.92
Most Recent Split Date: (:1)
Beta: 0.72
Market Capitalization: $1,908.01 (millions)
|
|
|
|
|
| |
| • EPS Information |
• Dividend Information |
| Analyst Coverage: No |
Dividend Yield: 1.60% |
| Current Fiscal Quarter EPS Consensus Estimate: $0.52 |
Indicated Annual Dividend: $0.60 |
| Current Fiscal Year EPS Consensus Estimate: $2.04 |
Payout Ratio: 0.29 |
| Number of Estimates in the Fiscal Year Consensus: 2.00 |
Change In Payout Ratio: 0.00 |
| Estmated Long-Term EPS Growth Rate: % |
Last Dividend Paid: 03/16/2026 - $0.15 |
| Next EPS Report Date: 07/24/26 |
|
|
|
| |