| Zacks Company Profile for SUMCO (SUOPY : OTC) |
|
|
| |
| • Company Description |
| Sumco Corporation manufactures and sells silicon wafers for the semiconductor industry. It offers monocrystalline ingots, polished wafers, annealed wafers, epitaxial wafers, junction isolated wafers, silicon-on-insulator wafers, and reclaimed polished wafers. The company operates primarily in Japan, North America, Asia and Europe. Sumco Corporation is headquartered in Tokyo, Japan.
Number of Employees: 9,714 |
|
|
| |
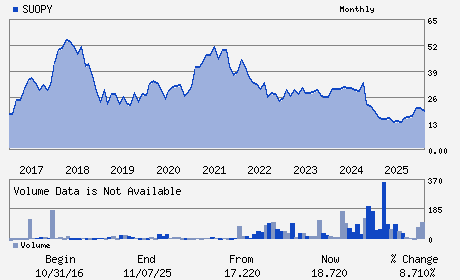
| • Price / Volume Information |
| Yesterday's Closing Price: $28.70 |
Daily Weekly Monthly
 |
| 20 Day Moving Average: 5,780 shares |
| Shares Outstanding: 174.86 (millions) |
| Market Capitalization: $5,018.37 (millions) |
| Beta: 1.08 |
| 52 Week High: $29.00 |
| 52 Week Low: $12.57 |
| Short Interest Ratio: |
| |
% Price Change |
% Price Change Relative to S&P 500 |
| 4 Week |
33.99% |
26.39% |
| 12 Week |
40.00% |
37.06% |
| Year To Date |
61.69% |
57.60% |
|
|
|
|
| |
| • Address & Contact Information |
| Street Address |
Phone / Fax |
Email Address |
Web URL |
Seavans North 1-2-1 Shibaura Minato-ku
-
Tokyo,M0 105-8634
JPN |
ph: 813-5444-0808
fax: - |
None |
http://www.sumcosi.com |
|
|
| |
| • General Corporate Information |
Officers
Mayuki Hashimoto - Chief Executive Officer and Chairman
Toshihiro Awa - President
Jiro Ryuta - Executive Vice President
Shinichi Kubozoe - Director
Takeo Katoh - Director
|
|
Peer Information
SUMCO (XCRA)
SUMCO (INTC)
SUMCO (NVDA)
SUMCO (TXN)
SUMCO (ISIL)
SUMCO (SUOPY)
|
|
Industry / Sector / Ticker Info
Analyst Coverage: No
Industry Group: SEMI-GENERAL
Sector: Computer and Technology
CUSIP: 86558P109
SIC: 3674
|
|
Fiscal Year
Fiscal Year End: December
Last Reported Quarter: 12/01/25
Next Expected EPS Date: 05/14/26
|
|
Share - Related Items
Shares Outstanding: 174.86
Most Recent Split Date: (:1)
Beta: 1.08
Market Capitalization: $5,018.37 (millions)
|
|
|
|
|
| |
| • EPS Information |
• Dividend Information |
| Analyst Coverage: No |
Dividend Yield: 0.60% |
| Current Fiscal Quarter EPS Consensus Estimate: $ |
Indicated Annual Dividend: $0.17 |
| Current Fiscal Year EPS Consensus Estimate: $-0.62 |
Payout Ratio: |
| Number of Estimates in the Fiscal Year Consensus: 1.00 |
Change In Payout Ratio: |
| Estmated Long-Term EPS Growth Rate: % |
Last Dividend Paid: NA - $0.00 |
| Next EPS Report Date: 05/14/26 |
|
|
|
| |