| Zacks Company Profile for Smith & Wesson Brands, Inc. (SWBI : NSDQ) |
|
|
| |
| • Company Description |
| Smith & Wesson Brands, Inc. designs, manufactures and sells firearms. The Company offers pistols, revolvers, rifles, handcuffs and other related products and accessories under the Smith & Wesson, M&P, Performance Center, Thompson/Center Arms and Gemtech brands. Smith & Wesson Brands, Inc., formerly known as American Outdoor Brands Corporation, is based in Springfield, Massachusetts.
Number of Employees: 1,416 |
|
|
| |
| • Price / Volume Information |
| Yesterday's Closing Price: $14.82 |
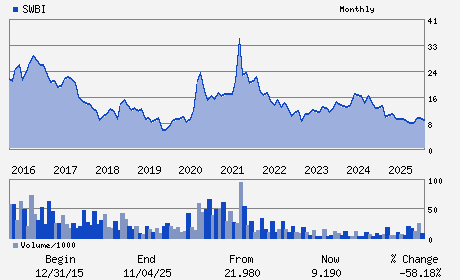
Daily Weekly Monthly
 |
| 20 Day Moving Average: 661,550 shares |
| Shares Outstanding: 44.49 (millions) |
| Market Capitalization: $659.40 (millions) |
| Beta: 0.90 |
| 52 Week High: $15.40 |
| 52 Week Low: $7.73 |
| Short Interest Ratio: |
| |
% Price Change |
% Price Change Relative to S&P 500 |
| 4 Week |
6.16% |
0.14% |
| 12 Week |
38.89% |
35.98% |
| Year To Date |
50.15% |
46.36% |
|
|
|
|
| |
|
|
| |
| • General Corporate Information |
Officers
Mark P. Smith - President; Chief Executive Officer; and Director
Robert L. Scott - Chairman of the Board
Deana L. McPherson - Executive Vice President; Chief Financial Officer;
Anita D. Britt - Director
Fred M. Diaz - Director
|
|
Peer Information
Smith & Wesson Brands, Inc. (BAJAY)
Smith & Wesson Brands, Inc. (ESCA)
Smith & Wesson Brands, Inc. (GOYL)
Smith & Wesson Brands, Inc. (FTSP)
Smith & Wesson Brands, Inc. (KTO)
Smith & Wesson Brands, Inc. (BOLL)
|
|
Industry / Sector / Ticker Info
Analyst Coverage: No
Industry Group: LEISURE&REC PRD
Sector: Consumer Discretionary
CUSIP: 831754106
SIC: 3480
|
|
Fiscal Year
Fiscal Year End: April
Last Reported Quarter: 01/01/26
Next Expected EPS Date: 06/17/26
|
|
Share - Related Items
Shares Outstanding: 44.49
Most Recent Split Date: (:1)
Beta: 0.90
Market Capitalization: $659.40 (millions)
|
|
|
|
|
| |
| • EPS Information |
• Dividend Information |
| Analyst Coverage: No |
Dividend Yield: 3.51% |
| Current Fiscal Quarter EPS Consensus Estimate: $ |
Indicated Annual Dividend: $0.52 |
| Current Fiscal Year EPS Consensus Estimate: $0.27 |
Payout Ratio: 2.17 |
| Number of Estimates in the Fiscal Year Consensus: 1.00 |
Change In Payout Ratio: 1.43 |
| Estmated Long-Term EPS Growth Rate: % |
Last Dividend Paid: 03/19/2026 - $0.13 |
| Next EPS Report Date: 06/17/26 |
|
|
|
| |