| Zacks Company Profile for Swire Pacific Ltd. (SWRAY : OTC) |
|
|
| |
| • Company Description |
| SWIRE PACIFIC LIMITED is one of Hong Kong's leading listed companies, with diversified interests in five operating divisions: Property, Aviation, Beverages, Marine Services and Trading & Industrial. The company's operations are predominantly based in the Greater China region, where the Swire group has been established for over 130 years. Swire Pacific seeks to foster long-term, sustainable growth through active participation in management, underpinned by a strong financial base.
Number of Employees: 92,000 |
|
|
| |
| • Price / Volume Information |
| Yesterday's Closing Price: $13.54 |
Daily Weekly Monthly
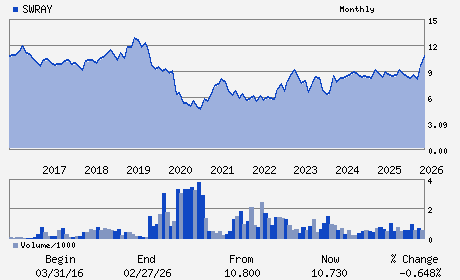 |
| 20 Day Moving Average: 29,850 shares |
| Shares Outstanding: 3,627.92 (millions) |
| Market Capitalization: $49,122.04 (millions) |
| Beta: 0.01 |
| 52 Week High: $14.28 |
| 52 Week Low: $7.77 |
| Short Interest Ratio: |
| |
% Price Change |
% Price Change Relative to S&P 500 |
| 4 Week |
3.44% |
2.76% |
| 12 Week |
7.55% |
1.43% |
| Year To Date |
68.62% |
48.80% |
|
|
|
|
| |
|
|
| |
| • General Corporate Information |
Officers
Guy Martin Coutts Bradley - Chairman
David Peter Cogman - Director
Patrick Healy - Director
Martin James Murray - Director
Zhuo Ping Zhang - Director
|
|
Peer Information
Swire Pacific Ltd. (COPIQ)
Swire Pacific Ltd. (AGPB)
Swire Pacific Ltd. (SDI)
Swire Pacific Ltd. (DES.)
Swire Pacific Ltd. (ASUP.)
Swire Pacific Ltd. (HON)
|
|
Industry / Sector / Ticker Info
Analyst Coverage: No
Industry Group: DIVERSIFIED OPS
Sector: Multi-Sector Conglomerates
CUSIP: 870794302
SIC: 8880
|
|
Fiscal Year
Fiscal Year End: December
Last Reported Quarter: -
Next Expected EPS Date: -
|
|
Share - Related Items
Shares Outstanding: 3,627.92
Most Recent Split Date: 7.00 (2.00:1)
Beta: 0.01
Market Capitalization: $49,122.04 (millions)
|
|
|
|
|
| |
| • EPS Information |
• Dividend Information |
| Analyst Coverage: No |
Dividend Yield: 2.52% |
| Current Fiscal Quarter EPS Consensus Estimate: $ |
Indicated Annual Dividend: $0.34 |
| Current Fiscal Year EPS Consensus Estimate: $1.41 |
Payout Ratio: |
| Number of Estimates in the Fiscal Year Consensus: 1.00 |
Change In Payout Ratio: |
| Estmated Long-Term EPS Growth Rate: 3.76% |
Last Dividend Paid: 09/10/2026 - $0.17 |
| Next EPS Report Date: - |
|
|
|
| |