| Zacks Company Profile for The Bancorp, Inc. (TBBK : NSDQ) |
|
|
| |
| • Company Description |
| The Bancorp Bank is a Delaware-chartered, federally insured commercial bank which focuses on service to small and mid-size businesses and their principals in the Philadelphia-Wilmington market area, and on private-label affinity group programs, including merchant card servicing.
Number of Employees: 733 |
|
|
| |
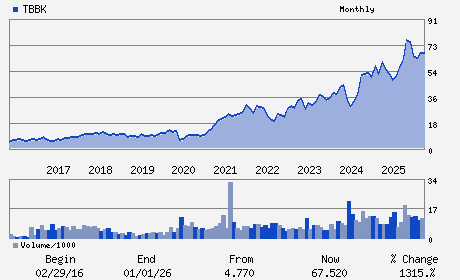
| • Price / Volume Information |
| Yesterday's Closing Price: $55.32 |
Daily Weekly Monthly
 |
| 20 Day Moving Average: 512,871 shares |
| Shares Outstanding: 41.63 (millions) |
| Market Capitalization: $2,303.19 (millions) |
| Beta: 1.26 |
| 52 Week High: $81.65 |
| 52 Week Low: $48.86 |
| Short Interest Ratio: |
| |
% Price Change |
% Price Change Relative to S&P 500 |
| 4 Week |
-8.52% |
-12.99% |
| 12 Week |
-3.25% |
-10.56% |
| Year To Date |
-18.07% |
-25.01% |
|
|
|
|
| |
| • Address & Contact Information |
| Street Address |
Phone / Fax |
Email Address |
Web URL |
409 SILVERSIDE ROAD
-
WILMINGTON,DE 19809
USA |
ph: 302-385-5000
fax: 302-385-5194 |
None |
http://www.thebancorp.com |
|
|
| |
| • General Corporate Information |
Officers
Damian M. Kozlowski - Chief Executive Officer; President and Director
Dominic Canuso - Chief Financial Officer
James J. McEntee III - Director
Matthew Cohn - Director
William H. Lamb - Director
|
|
Peer Information
The Bancorp, Inc. (CNBKA)
The Bancorp, Inc. (CNBI2)
The Bancorp, Inc. (CNOB)
The Bancorp, Inc. (FBNK.)
The Bancorp, Inc. (FMBN)
The Bancorp, Inc. (TBNK)
|
|
Industry / Sector / Ticker Info
Analyst Coverage: No
Industry Group: BANKS-NORTHEAST
Sector: Finance
CUSIP: 05969A105
SIC: 6021
|
|
Fiscal Year
Fiscal Year End: December
Last Reported Quarter: 03/01/26
Next Expected EPS Date: 07/23/26
|
|
Share - Related Items
Shares Outstanding: 41.63
Most Recent Split Date: 12.00 (1.15:1)
Beta: 1.26
Market Capitalization: $2,303.19 (millions)
|
|
|
|
|
| |
| • EPS Information |
• Dividend Information |
| Analyst Coverage: No |
Dividend Yield: 0.00% |
| Current Fiscal Quarter EPS Consensus Estimate: $1.37 |
Indicated Annual Dividend: $0.00 |
| Current Fiscal Year EPS Consensus Estimate: $5.95 |
Payout Ratio: 0.00 |
| Number of Estimates in the Fiscal Year Consensus: 2.00 |
Change In Payout Ratio: 0.00 |
| Estmated Long-Term EPS Growth Rate: % |
Last Dividend Paid: NA - $0.00 |
| Next EPS Report Date: 07/23/26 |
|
|
|
| |