| Zacks Company Profile for Toronto Dominion Bank (The) (TD : NYSE) |
|
|
| |
| • Company Description |
| Toronto Dominion Bank is a Canadian chartered bank and offers a wide range of business and consumer services. These services include checking and savings accounts, credit cards, mortgage and student loans,trusts, wills, estate planning,investment management services and financial and advisory services.
Number of Employees: 102,218 |
|
|
| |
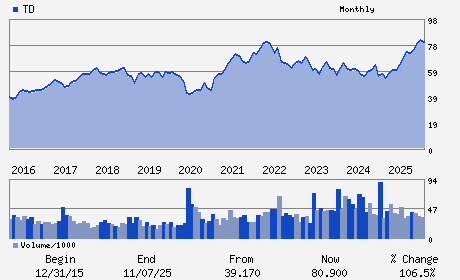
| • Price / Volume Information |
| Yesterday's Closing Price: $111.87 |
Daily Weekly Monthly
 |
| 20 Day Moving Average: 1,548,350 shares |
| Shares Outstanding: 1,656.17 (millions) |
| Market Capitalization: $185,275.97 (millions) |
| Beta: 0.71 |
| 52 Week High: $112.32 |
| 52 Week Low: $66.53 |
| Short Interest Ratio: |
| |
% Price Change |
% Price Change Relative to S&P 500 |
| 4 Week |
6.51% |
1.31% |
| 12 Week |
13.25% |
4.70% |
| Year To Date |
18.76% |
8.44% |
|
|
|
|
| |
| • Address & Contact Information |
| Street Address |
Phone / Fax |
Email Address |
Web URL |
Toronto-Dominion Centre
-
Toronto,A6 M5K 1A2
CAN |
ph: 416-944-6367
fax: 416-982-6166 |
tdir@td.com |
http://www.td.com |
|
|
| |
| • General Corporate Information |
Officers
Raymond Chun - President and Chief Executive Officer
John B. MacIntyre - Chairman
Kelvin Tran - Chief Financial Officer
Taylan Turan - Cheif Oparating Officier
Nadir H. Mohamed - Director
|
|
Peer Information
Toronto Dominion Bank (The) (BKAU)
Toronto Dominion Bank (The) (BKEAY)
Toronto Dominion Bank (The) (BKNIY)
Toronto Dominion Bank (The) (BKJAY)
Toronto Dominion Bank (The) (ABNYY)
Toronto Dominion Bank (The) (BNSTY)
|
|
Industry / Sector / Ticker Info
Analyst Coverage: No
Industry Group: BANKS-FOREIGN
Sector: Finance
CUSIP: 891160509
SIC: 6029
|
|
Fiscal Year
Fiscal Year End: October
Last Reported Quarter: 01/01/26
Next Expected EPS Date: 05/28/26
|
|
Share - Related Items
Shares Outstanding: 1,656.17
Most Recent Split Date: 2.00 (2.00:1)
Beta: 0.71
Market Capitalization: $185,275.97 (millions)
|
|
|
|
|
| |
| • EPS Information |
• Dividend Information |
| Analyst Coverage: No |
Dividend Yield: 2.78% |
| Current Fiscal Quarter EPS Consensus Estimate: $1.74 |
Indicated Annual Dividend: $3.11 |
| Current Fiscal Year EPS Consensus Estimate: $6.89 |
Payout Ratio: 0.47 |
| Number of Estimates in the Fiscal Year Consensus: 3.00 |
Change In Payout Ratio: 0.00 |
| Estmated Long-Term EPS Growth Rate: 12.98% |
Last Dividend Paid: 04/09/2026 - $0.78 |
| Next EPS Report Date: 05/28/26 |
|
|
|
| |