| Zacks Company Profile for TG Therapeutics, Inc. (TGTX : NSDQ) |
|
|
| |
| • Company Description |
| TG Therapeutics, Inc. is a biopharmaceutical company focused on the acquisition, development and commercialization of pharmaceutical products for the treatment of cancer and other underserved therapeutic needs. The Company is focused on the development of a monoclonal antibody for the treatment of various B-cell proliferative disorders including lymphoma, leukemia, and auto-immune diseases. TG Therapeutics, Inc., formerly known as Manhattan Pharmaceuticals, Inc., is based in New York.
Number of Employees: 399 |
|
|
| |
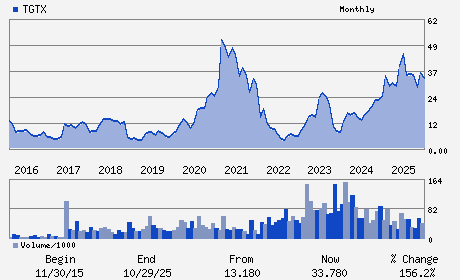
| • Price / Volume Information |
| Yesterday's Closing Price: $38.87 |
Daily Weekly Monthly
 |
| 20 Day Moving Average: 2,239,056 shares |
| Shares Outstanding: 153.08 (millions) |
| Market Capitalization: $5,950.38 (millions) |
| Beta: 1.68 |
| 52 Week High: $44.65 |
| 52 Week Low: $25.28 |
| Short Interest Ratio: |
| |
% Price Change |
% Price Change Relative to S&P 500 |
| 4 Week |
5.28% |
0.14% |
| 12 Week |
25.79% |
16.29% |
| Year To Date |
30.39% |
21.02% |
|
|
|
|
| |
| • Address & Contact Information |
| Street Address |
Phone / Fax |
Email Address |
Web URL |
3020 CARRINGTON MILL BLVD SUITE 475
-
MORRISVILLE,NC 27560
USA |
ph: 877-575-8489
fax: 212-554-4531 |
ir@tgtxinc.com |
http://www.tgtherapeutics.com |
|
|
| |
| • General Corporate Information |
Officers
Michael S. Weiss - Chairman; Chief Executive Officer and President
Sean A. Power - Chief Financial Officer; Treasurer and Corporate S
Laurence N. Charney - Director
Yann Echelard - Director
Kenneth Hoberman - Director
|
|
Peer Information
TG Therapeutics, Inc. (CORR.)
TG Therapeutics, Inc. (RSPI)
TG Therapeutics, Inc. (CGXP)
TG Therapeutics, Inc. (BGEN)
TG Therapeutics, Inc. (GTBP)
TG Therapeutics, Inc. (RGRX)
|
|
Industry / Sector / Ticker Info
Analyst Coverage: No
Industry Group: MED-BIOMED/GENE
Sector: Medical
CUSIP: 88322Q108
SIC: 2834
|
|
Fiscal Year
Fiscal Year End: December
Last Reported Quarter: 03/01/26
Next Expected EPS Date: 08/03/26
|
|
Share - Related Items
Shares Outstanding: 153.08
Most Recent Split Date: 4.00 (0.02:1)
Beta: 1.68
Market Capitalization: $5,950.38 (millions)
|
|
|
|
|
| |
| • EPS Information |
• Dividend Information |
| Analyst Coverage: No |
Dividend Yield: 0.00% |
| Current Fiscal Quarter EPS Consensus Estimate: $0.38 |
Indicated Annual Dividend: $0.00 |
| Current Fiscal Year EPS Consensus Estimate: $1.31 |
Payout Ratio: 0.00 |
| Number of Estimates in the Fiscal Year Consensus: 4.00 |
Change In Payout Ratio: 0.00 |
| Estmated Long-Term EPS Growth Rate: % |
Last Dividend Paid: NA - $0.00 |
| Next EPS Report Date: 08/03/26 |
|
|
|
| |