| Zacks Company Profile for Tele Group Corp. (TMLL : OTC) |
|
|
| |
| • Company Description |
| NeXplore Corporation is a Web 2.0 Software Development company focussed to create a series of dynamic, user-focused Internet properties and applications. The Company offers an array of search of search, display, and interactive advertising products to reach and engage targeted consumers. NeXplore's products under development consist of NeXplore Search, a search engine, featuring a graphical user interface to allow the user to interact with the search results themselves and the advertisements that are presented to them, as well as to refine their search results by leveraging the collective intelligence of social communities of other users; and NeXplore Ads, a proprietary ad creation and management platform that enables marketers to create, manage, and modify, in real time, targeted interactive online advertising campaigns. NeXplore Corporation is headquartered in Plano, Texas.
Number of Employees: |
|
|
| |
| • Price / Volume Information |
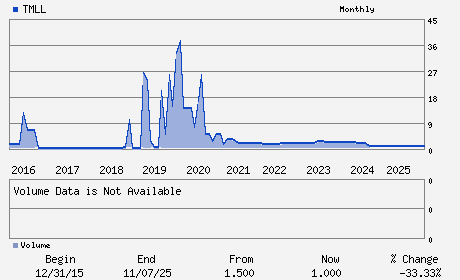
| Yesterday's Closing Price: $1.00 |
Daily Weekly Monthly
 |
| 20 Day Moving Average: 0 shares |
| Shares Outstanding: 62.40 (millions) |
| Market Capitalization: $62.40 (millions) |
| Beta: -0.14 |
| 52 Week High: $ |
| 52 Week Low: $ |
| Short Interest Ratio: |
| |
% Price Change |
% Price Change Relative to S&P 500 |
| 4 Week |
0.00% |
-5.67% |
| 12 Week |
0.00% |
-2.10% |
| Year To Date |
0.00% |
-2.53% |
|
|
|
|
| |
| • Address & Contact Information |
| Street Address |
Phone / Fax |
Email Address |
Web URL |
3445 Lawrence Ave
-
Oceanside,NY 11572
USA |
ph: 310-734-2626
fax: 469-362-7634 |
None |
http://www.nexplore.com |
|
|
| |
| • General Corporate Information |
Officers
Edward W. Mandel - C.E.O.;Principal Executive Officer ;Director
Paul O. Williams - Principal Financial Officer;P.A.O;Director
- - -
- - -
- - -
|
|
Peer Information
- (-)
- (-)
- (-)
- (-)
- (-)
- (-)
|
|
Industry / Sector / Ticker Info
Analyst Coverage: No
Industry Group: Internet Services - Delivery
Sector: Computer and Technology
CUSIP: 87925H101
SIC: 4953
|
|
Fiscal Year
Fiscal Year End: June
Last Reported Quarter: -
Next Expected EPS Date: -
|
|
Share - Related Items
Shares Outstanding: 62.40
Most Recent Split Date: 12.00 (0.02:1)
Beta: -0.14
Market Capitalization: $62.40 (millions)
|
|
|
|
|
| |
| • EPS Information |
• Dividend Information |
| Analyst Coverage: No |
Dividend Yield: 0.00% |
| Current Fiscal Quarter EPS Consensus Estimate: $ |
Indicated Annual Dividend: $0.00 |
| Current Fiscal Year EPS Consensus Estimate: $ |
Payout Ratio: |
| Number of Estimates in the Fiscal Year Consensus: |
Change In Payout Ratio: |
| Estmated Long-Term EPS Growth Rate: % |
Last Dividend Paid: NA - $0.00 |
| Next EPS Report Date: - |
|
|
|
| |