| Zacks Company Profile for TriNet Group, Inc. (TNET : NYSE) |
|
|
| |
| • Company Description |
| TriNet Group, Inc. is a provider of a comprehensive human resources solution for small to medium-sized businesses. It offers payroll, tax administration, risk protection, performance management, compensation consulting, and employee benefit plans. The Company serves banking and financial services, biotech and life sciences, technology, non-profits, professional services, venture capital, and advertising and marketing industries. TriNet Group, Inc. is headquartered in San Leandro, California.
Number of Employees: 3,400 |
|
|
| |
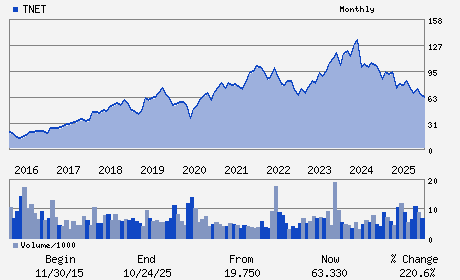
| • Price / Volume Information |
| Yesterday's Closing Price: $42.78 |
Daily Weekly Monthly
 |
| 20 Day Moving Average: 432,192 shares |
| Shares Outstanding: 45.94 (millions) |
| Market Capitalization: $1,965.53 (millions) |
| Beta: 1.02 |
| 52 Week High: $84.08 |
| 52 Week Low: $33.61 |
| Short Interest Ratio: |
| |
% Price Change |
% Price Change Relative to S&P 500 |
| 4 Week |
9.95% |
4.58% |
| 12 Week |
13.44% |
4.87% |
| Year To Date |
-27.65% |
-34.96% |
|
|
|
|
| |
|
|
| |
| • General Corporate Information |
Officers
Michael Q. Simonds - Chief Executive Officer
Mala Murthy - Chief Financial Officer
Michael J. Angelakis - Director
Paul Chamberlain - Director
Ralph Clark - Director
|
|
Peer Information
TriNet Group, Inc. (CGEMY)
TriNet Group, Inc. (GLXG)
TriNet Group, Inc. (SRT)
TriNet Group, Inc. (CVG)
TriNet Group, Inc. (HEW)
TriNet Group, Inc. (BBSI)
|
|
Industry / Sector / Ticker Info
Analyst Coverage: No
Industry Group: Outsourcing
Sector: Business Services
CUSIP: 896288107
SIC: 7389
|
|
Fiscal Year
Fiscal Year End: December
Last Reported Quarter: 03/01/26
Next Expected EPS Date: 07/24/26
|
|
Share - Related Items
Shares Outstanding: 45.94
Most Recent Split Date: (:1)
Beta: 1.02
Market Capitalization: $1,965.53 (millions)
|
|
|
|
|
| |
| • EPS Information |
• Dividend Information |
| Analyst Coverage: No |
Dividend Yield: 2.71% |
| Current Fiscal Quarter EPS Consensus Estimate: $0.72 |
Indicated Annual Dividend: $1.16 |
| Current Fiscal Year EPS Consensus Estimate: $3.55 |
Payout Ratio: 0.27 |
| Number of Estimates in the Fiscal Year Consensus: 3.00 |
Change In Payout Ratio: 0.16 |
| Estmated Long-Term EPS Growth Rate: % |
Last Dividend Paid: 04/01/2026 - $0.29 |
| Next EPS Report Date: 07/24/26 |
|
|
|
| |