| Zacks Company Profile for Transcat, Inc. (TRNS : NSDQ) |
|
|
| |
| • Company Description |
| Transcat, Inc. distributes test and measurement instruments and provides accredited calibration services to a variety of industries including life sciences, pharmaceutical, petroleum refining, chemical manufacturing, public utility, pulp and paper, communications, automotive and aerospace.
Number of Employees: 1,245 |
|
|
| |
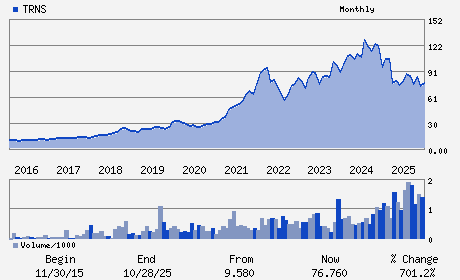
| • Price / Volume Information |
| Yesterday's Closing Price: $78.39 |
Daily Weekly Monthly
 |
| 20 Day Moving Average: 121,448 shares |
| Shares Outstanding: 9.33 (millions) |
| Market Capitalization: $731.55 (millions) |
| Beta: 0.71 |
| 52 Week High: $97.08 |
| 52 Week Low: $50.23 |
| Short Interest Ratio: |
| |
% Price Change |
% Price Change Relative to S&P 500 |
| 4 Week |
6.35% |
0.32% |
| 12 Week |
22.22% |
19.65% |
| Year To Date |
38.18% |
34.69% |
|
|
|
|
| |
|
|
| |
| • General Corporate Information |
Officers
Lee D. Rudow - President and Chief Executive Officer
Gary J. Haseley - Chairman
Thomas L. Barbato - Senior Vice President of Finance and Chief Financi
Scott D. Deverell - Controller and Principal Accounting Officer
Craig D. Cairns - Director
|
|
Peer Information
Transcat, Inc. (BEIQ)
Transcat, Inc. (THR)
Transcat, Inc. (EDCO)
Transcat, Inc. (TRCI)
Transcat, Inc. (MOCO)
Transcat, Inc. (ACSEF)
|
|
Industry / Sector / Ticker Info
Analyst Coverage: No
Industry Group: INSTRU-CONTROL
Sector: Computer and Technology
CUSIP: 893529107
SIC: 3825
|
|
Fiscal Year
Fiscal Year End: March
Last Reported Quarter: 12/01/25
Next Expected EPS Date: 05/18/26
|
|
Share - Related Items
Shares Outstanding: 9.33
Most Recent Split Date: 7.00 (2.00:1)
Beta: 0.71
Market Capitalization: $731.55 (millions)
|
|
|
|
|
| |
| • EPS Information |
• Dividend Information |
| Analyst Coverage: No |
Dividend Yield: 0.00% |
| Current Fiscal Quarter EPS Consensus Estimate: $0.44 |
Indicated Annual Dividend: $0.00 |
| Current Fiscal Year EPS Consensus Estimate: $1.86 |
Payout Ratio: 0.00 |
| Number of Estimates in the Fiscal Year Consensus: 2.00 |
Change In Payout Ratio: 0.00 |
| Estmated Long-Term EPS Growth Rate: % |
Last Dividend Paid: NA - $0.00 |
| Next EPS Report Date: 05/18/26 |
|
|
|
| |