| Zacks Company Profile for Tenaris S.A. (TS : NYSE) |
|
|
| |
| • Company Description |
| Tenaris Sa, a corporation organized in Luxembourg, is a leading manufacturer and supplier of seamless steel pipe products and associated services to the oil and gas, energy and other industries. Tenaris's operating subsidiaries include eight established steel pipe manufacturers: AlgomaTubes, Confab, Dalmine, NKKTubes, Siat, Siderca, Tamsa and Tavsa.
Number of Employees: 24,875 |
|
|
| |
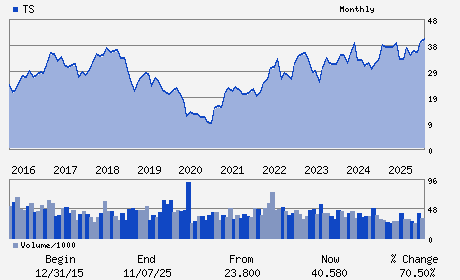
| • Price / Volume Information |
| Yesterday's Closing Price: $61.61 |
Daily Weekly Monthly
 |
| 20 Day Moving Average: 1,820,035 shares |
| Shares Outstanding: 536.00 (millions) |
| Market Capitalization: $33,022.78 (millions) |
| Beta: 0.85 |
| 52 Week High: $64.33 |
| 52 Week Low: $32.14 |
| Short Interest Ratio: |
| |
% Price Change |
% Price Change Relative to S&P 500 |
| 4 Week |
-1.63% |
-6.43% |
| 12 Week |
13.23% |
4.68% |
| Year To Date |
60.23% |
47.70% |
|
|
|
|
| |
|
|
| |
| • General Corporate Information |
Officers
Paolo Rocca - Chief Executive Officer and Chairman
Gabriel Podskubka - Chief Operating Officer
Carlos Gomez Alzaga - Chief Financial Officer
Simon Ayat - Director
Roberto Bonatti - Director
|
|
Peer Information
Tenaris S.A. (NSS)
Tenaris S.A. (AIU)
Tenaris S.A. (DBMG)
Tenaris S.A. (PPIH)
Tenaris S.A. (TAM.)
Tenaris S.A. (VMI)
|
|
Industry / Sector / Ticker Info
Analyst Coverage: No
Industry Group: STEEL-PIPE&TUBE
Sector: Industrial Products
CUSIP: 88031M109
SIC: 3312
|
|
Fiscal Year
Fiscal Year End: December
Last Reported Quarter: 03/01/26
Next Expected EPS Date: 07/29/26
|
|
Share - Related Items
Shares Outstanding: 536.00
Most Recent Split Date: 4.00 (5.00:1)
Beta: 0.85
Market Capitalization: $33,022.78 (millions)
|
|
|
|
|
| |
| • EPS Information |
• Dividend Information |
| Analyst Coverage: No |
Dividend Yield: 3.90% |
| Current Fiscal Quarter EPS Consensus Estimate: $0.81 |
Indicated Annual Dividend: $2.40 |
| Current Fiscal Year EPS Consensus Estimate: $3.67 |
Payout Ratio: 0.31 |
| Number of Estimates in the Fiscal Year Consensus: 6.00 |
Change In Payout Ratio: -0.01 |
| Estmated Long-Term EPS Growth Rate: 11.24% |
Last Dividend Paid: NA - $0.00 |
| Next EPS Report Date: 07/29/26 |
|
|
|
| |