| Zacks Company Profile for TTM Technologies, Inc. (TTMI : NSDQ) |
|
|
| |
| • Company Description |
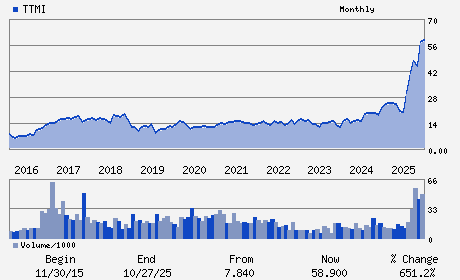
| TTM Technologies, Inc. is a leading global printed circuit board manufacturer, focusing on quick-turn and volume production of technologically advanced PCBs, backplane assemblies and electro-mechanical solutions. TTM stands for time-to-market, representing how TTM's time-critical, one-stop manufacturing services enable customers to shorten the time required to develop new products and bring them to market.
Number of Employees: 18,200 |
|
|
| |
| • Price / Volume Information |
| Yesterday's Closing Price: $116.60 |
Daily Weekly Monthly
 |
| 20 Day Moving Average: 1,772,337 shares |
| Shares Outstanding: 103.84 (millions) |
| Market Capitalization: $12,108.12 (millions) |
| Beta: 1.76 |
| 52 Week High: $126.71 |
| 52 Week Low: $17.93 |
| Short Interest Ratio: |
| |
% Price Change |
% Price Change Relative to S&P 500 |
| 4 Week |
22.34% |
15.40% |
| 12 Week |
16.75% |
14.30% |
| Year To Date |
68.99% |
64.72% |
|
|
|
|
| |
| • Address & Contact Information |
| Street Address |
Phone / Fax |
Email Address |
Web URL |
200 EAST SANDPOINTE SUITE 400
-
SANTA ANA,CA 92707
USA |
ph: 714-327-3000
fax: 302-655-5049 |
sean.hannan@ttmtech.com |
http://www.ttm.com |
|
|
| |
| • General Corporate Information |
Officers
Edwin Roks - President; Chief Executive Officer; and Director
Rex D. Geveden - Chairman
Daniel L. Boehle - Executive Vice President and Chief Financial Off
Wajid Ali - Director
Thomas T. Edman - Director
|
|
Peer Information
TTM Technologies, Inc. (SMTI.)
TTM Technologies, Inc. (DDICQ)
TTM Technologies, Inc. (CGGIQ)
TTM Technologies, Inc. (CRDN)
TTM Technologies, Inc. (CDTS)
TTM Technologies, Inc. (AURAQ)
|
|
Industry / Sector / Ticker Info
Analyst Coverage: No
Industry Group: ELEC-MISC COMPONENTS
Sector: Computer and Technology
CUSIP: 87305R109
SIC: 3672
|
|
Fiscal Year
Fiscal Year End: December
Last Reported Quarter: 12/01/25
Next Expected EPS Date: 04/29/26
|
|
Share - Related Items
Shares Outstanding: 103.84
Most Recent Split Date: (:1)
Beta: 1.76
Market Capitalization: $12,108.12 (millions)
|
|
|
|
|
| |
| • EPS Information |
• Dividend Information |
| Analyst Coverage: No |
Dividend Yield: 0.00% |
| Current Fiscal Quarter EPS Consensus Estimate: $0.63 |
Indicated Annual Dividend: $0.00 |
| Current Fiscal Year EPS Consensus Estimate: $2.93 |
Payout Ratio: 0.00 |
| Number of Estimates in the Fiscal Year Consensus: 3.00 |
Change In Payout Ratio: 0.00 |
| Estmated Long-Term EPS Growth Rate: % |
Last Dividend Paid: NA - $0.00 |
| Next EPS Report Date: 04/29/26 |
|
|
|
| |