| Zacks Company Profile for Tvardi Therapeutics, Inc. (TVRD : NSDQ) |
|
|
| |
| • Company Description |
| Tvardi Therapeutics Inc. is a privately held, clinical-stage, biopharmaceutical company focused on the development of novel, oral small molecule therapies targeting STAT3 to treat fibrosis-driven diseases with significant unmet need. Tvardi Therapeutics Inc., formerly known as Cara Therapeutics Inc., is based in STAMFORD, Conn.
Number of Employees: 12 |
|
|
| |
| • Price / Volume Information |
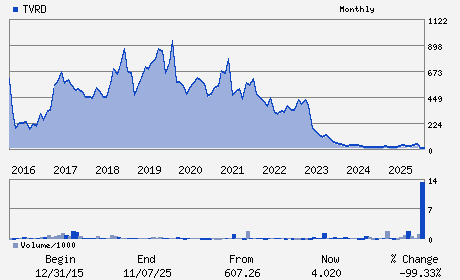
| Yesterday's Closing Price: $3.57 |
Daily Weekly Monthly
 |
| 20 Day Moving Average: 43,379 shares |
| Shares Outstanding: 9.38 (millions) |
| Market Capitalization: $33.49 (millions) |
| Beta: 0.30 |
| 52 Week High: $43.65 |
| 52 Week Low: $2.75 |
| Short Interest Ratio: |
| |
% Price Change |
% Price Change Relative to S&P 500 |
| 4 Week |
18.60% |
12.81% |
| 12 Week |
-11.85% |
-18.51% |
| Year To Date |
-16.98% |
-23.24% |
|
|
|
|
| |
|
|
| |
| • General Corporate Information |
Officers
Imran Alibhai - Chief Executive Officer and Director
Sujal Shah - Chairman
Dan Conn - Chief Financial Officer
Wallace Hall - Director
Michael S. Wyzga - Director
|
|
Peer Information
Tvardi Therapeutics, Inc. (CORR.)
Tvardi Therapeutics, Inc. (RSPI)
Tvardi Therapeutics, Inc. (CGXP)
Tvardi Therapeutics, Inc. (BGEN)
Tvardi Therapeutics, Inc. (GTBP)
Tvardi Therapeutics, Inc. (RGRX)
|
|
Industry / Sector / Ticker Info
Analyst Coverage: No
Industry Group: MED-BIOMED/GENE
Sector: Medical
CUSIP: 140755307
SIC: 2834
|
|
Fiscal Year
Fiscal Year End: December
Last Reported Quarter: 03/01/26
Next Expected EPS Date: 08/13/26
|
|
Share - Related Items
Shares Outstanding: 9.38
Most Recent Split Date: 4.00 (0.33:1)
Beta: 0.30
Market Capitalization: $33.49 (millions)
|
|
|
|
|
| |
| • EPS Information |
• Dividend Information |
| Analyst Coverage: No |
Dividend Yield: 0.00% |
| Current Fiscal Quarter EPS Consensus Estimate: $-0.61 |
Indicated Annual Dividend: $0.00 |
| Current Fiscal Year EPS Consensus Estimate: $-2.10 |
Payout Ratio: |
| Number of Estimates in the Fiscal Year Consensus: 4.00 |
Change In Payout Ratio: |
| Estmated Long-Term EPS Growth Rate: % |
Last Dividend Paid: NA - $0.00 |
| Next EPS Report Date: 08/13/26 |
|
|
|
| |