| Zacks Company Profile for Titan International, Inc. (TWI : NYSE) |
|
|
| |
| • Company Description |
| Titan International, Inc. is a leading global manufacturer of off-highway wheels, tires, assemblies, and undercarriage products. The company globally produces a broad range of products to meet the specifications of original equipment manufacturers (OEMs) and aftermarket customers in the agricultural, earthmoving/construction, and consumer markets.
Number of Employees: 8,200 |
|
|
| |
| • Price / Volume Information |
| Yesterday's Closing Price: $6.84 |
Daily Weekly Monthly
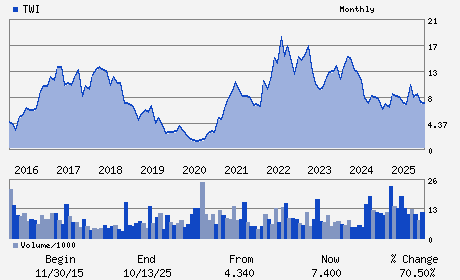 |
| 20 Day Moving Average: 586,208 shares |
| Shares Outstanding: 64.54 (millions) |
| Market Capitalization: $441.47 (millions) |
| Beta: 1.43 |
| 52 Week High: $11.70 |
| 52 Week Low: $6.37 |
| Short Interest Ratio: |
| |
% Price Change |
% Price Change Relative to S&P 500 |
| 4 Week |
-5.52% |
-6.15% |
| 12 Week |
-10.59% |
-15.67% |
| Year To Date |
-12.64% |
-22.91% |
|
|
|
|
| |
|
|
| |
| • General Corporate Information |
Officers
Paul G. Reitz - Chief Executive Officer; President and Director
Maurice M. Taylor - Chairman
Tony C. Eheli - Chief Financial Officer; Senior Vice President
James M. Pach - Chief Accounting Officer; Vice President
Richard M. Cashin - Director
|
|
Peer Information
Titan International, Inc. (M.BUD)
Titan International, Inc. (DCNAQ)
Titan International, Inc. (CGUL)
Titan International, Inc. (DAN)
Titan International, Inc. (CTTAY)
Titan International, Inc. (M.DEC)
|
|
Industry / Sector / Ticker Info
Analyst Coverage: No
Industry Group: AUTO/TRUCK-ORIG
Sector: Auto/Tires/Trucks
CUSIP: 88830M102
SIC: 3312
|
|
Fiscal Year
Fiscal Year End: December
Last Reported Quarter: 06/01/26
Next Expected EPS Date: 10/29/26
|
|
Share - Related Items
Shares Outstanding: 64.54
Most Recent Split Date: 8.00 (1.25:1)
Beta: 1.43
Market Capitalization: $441.47 (millions)
|
|
|
|
|
| |
| • EPS Information |
• Dividend Information |
| Analyst Coverage: No |
Dividend Yield: 0.00% |
| Current Fiscal Quarter EPS Consensus Estimate: $-0.16 |
Indicated Annual Dividend: $0.00 |
| Current Fiscal Year EPS Consensus Estimate: $-0.12 |
Payout Ratio: |
| Number of Estimates in the Fiscal Year Consensus: 4.00 |
Change In Payout Ratio: |
| Estmated Long-Term EPS Growth Rate: % |
Last Dividend Paid: NA - $0.00 |
| Next EPS Report Date: 10/29/26 |
|
|
|
| |