| Zacks Company Profile for TXNM Energy, Inc. (TXNM : NYSE) |
|
|
| |
| • Company Description |
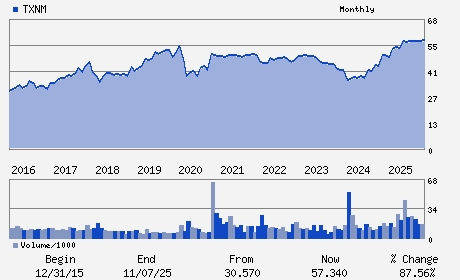
| TXNM Energy is an energy holding company which delivers energy to homes and businesses across Texas and New Mexico through its regulated utilities, TNMP and PNM. TXNM Energy, formerly known as PNM Resources, is based in ALBUQUERQUE, N.M.
Number of Employees: 1,700 |
|
|
| |
| • Price / Volume Information |
| Yesterday's Closing Price: $59.47 |
Daily Weekly Monthly
 |
| 20 Day Moving Average: 1,455,452 shares |
| Shares Outstanding: 110.71 (millions) |
| Market Capitalization: $6,583.75 (millions) |
| Beta: 0.16 |
| 52 Week High: $59.52 |
| 52 Week Low: $56.17 |
| Short Interest Ratio: |
| |
% Price Change |
% Price Change Relative to S&P 500 |
| 4 Week |
0.80% |
-4.13% |
| 12 Week |
0.54% |
-7.05% |
| Year To Date |
1.00% |
-7.14% |
|
|
|
|
| |
|
|
| |
| • General Corporate Information |
Officers
J. D. Tarry - Chief Executive Officer
P. K. Collawn - Chairman of the Board
H. E. Monroy - Senior Vice President and Chief Financial Officer
B. G. Iverson - General Counsel and Corporate Secretary
V.A. Bailey - Director
|
|
Peer Information
TXNM Energy, Inc. (APWR)
TXNM Energy, Inc. (USFCQ)
TXNM Energy, Inc. (SGII.)
TXNM Energy, Inc. (APGI)
TXNM Energy, Inc. (HYDP)
TXNM Energy, Inc. (FCEL)
|
|
Industry / Sector / Ticker Info
Analyst Coverage: No
Industry Group: Other Alt Energy
Sector: Oils/Energy
CUSIP: 69349H107
SIC: 4911
|
|
Fiscal Year
Fiscal Year End: December
Last Reported Quarter: 03/01/26
Next Expected EPS Date: 08/07/26
|
|
Share - Related Items
Shares Outstanding: 110.71
Most Recent Split Date: 6.00 (1.50:1)
Beta: 0.16
Market Capitalization: $6,583.75 (millions)
|
|
|
|
|
| |
| • EPS Information |
• Dividend Information |
| Analyst Coverage: No |
Dividend Yield: 2.84% |
| Current Fiscal Quarter EPS Consensus Estimate: $ |
Indicated Annual Dividend: $1.69 |
| Current Fiscal Year EPS Consensus Estimate: $3.07 |
Payout Ratio: 0.74 |
| Number of Estimates in the Fiscal Year Consensus: 3.00 |
Change In Payout Ratio: 0.15 |
| Estmated Long-Term EPS Growth Rate: 7.56% |
Last Dividend Paid: 04/27/2026 - $0.42 |
| Next EPS Report Date: 08/07/26 |
|
|
|
| |