| Zacks Company Profile for UFP Industries, Inc. (UFPI : NSDQ) |
|
|
| |
| • Company Description |
| UFP Industries, Inc. is a holding company with its subsidiaries throughout N. America, Europe, Asia and Australia. The company supplies wood, wood composite and other products in retail, industrial, and construction market. The company classifies its top-line results based on its end markets. A brief snapshot of the end market sales has been provided as follows. UFP Retail includes Do-It-Yourself retailers, and distributors, pro-dealers and other retail customers. UFP Industrial consists of packaging, crating and other products for manufacturers. UFP Construction comprises Residential Construction, Commercial Construction and Concrete Forming and Manufactured Housing sales. Residential Construction includes builders of single and multifamily homes. Commercial Construction and Concrete Forming includes non-residential construction and concrete forming. Manufactured Housing includes manufactured housing and recreational vehicles business.
Number of Employees: 13,800 |
|
|
| |
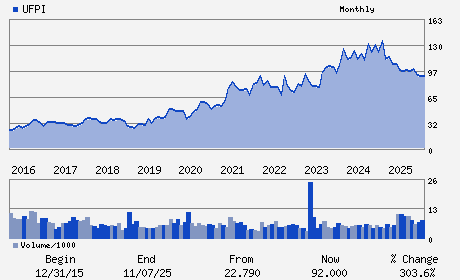
| • Price / Volume Information |
| Yesterday's Closing Price: $80.54 |
Daily Weekly Monthly
 |
| 20 Day Moving Average: 572,519 shares |
| Shares Outstanding: 56.48 (millions) |
| Market Capitalization: $4,548.90 (millions) |
| Beta: 1.29 |
| 52 Week High: $118.00 |
| 52 Week Low: $77.89 |
| Short Interest Ratio: |
| |
% Price Change |
% Price Change Relative to S&P 500 |
| 4 Week |
-16.52% |
-20.60% |
| 12 Week |
-23.32% |
-29.12% |
| Year To Date |
-11.54% |
-18.63% |
|
|
|
|
| |
| • Address & Contact Information |
| Street Address |
Phone / Fax |
Email Address |
Web URL |
2801 East Beltline NE.
-
Grand Rapids,MI 49525
USA |
ph: 616-364-6161
fax: 616-361-8302 |
None |
http://www.ufpi.com |
|
|
| |
| • General Corporate Information |
Officers
William D. Schwartz - Chief Executive Officer and Principal Executive Of
Matthew J. Missad - Executive Chairman and Director
Michael R. Cole - Chief Financial Officer; Principal Financial Offic
Joan A. Budden - Director
Benjamin J. McLean - Director
|
|
Peer Information
UFP Industries, Inc. (DURX)
UFP Industries, Inc. (NWGL)
UFP Industries, Inc. (DEL)
UFP Industries, Inc. (CRPP)
UFP Industries, Inc. (POPE)
UFP Industries, Inc. (BTEK.)
|
|
Industry / Sector / Ticker Info
Analyst Coverage: No
Industry Group: BLDG PRD-WOOD
Sector: Construction
CUSIP: 90278Q108
SIC: 2421
|
|
Fiscal Year
Fiscal Year End: December
Last Reported Quarter: 03/01/26
Next Expected EPS Date: 07/27/26
|
|
Share - Related Items
Shares Outstanding: 56.48
Most Recent Split Date: 11.00 (3.00:1)
Beta: 1.29
Market Capitalization: $4,548.90 (millions)
|
|
|
|
|
| |
| • EPS Information |
• Dividend Information |
| Analyst Coverage: No |
Dividend Yield: 1.79% |
| Current Fiscal Quarter EPS Consensus Estimate: $1.46 |
Indicated Annual Dividend: $1.44 |
| Current Fiscal Year EPS Consensus Estimate: $4.77 |
Payout Ratio: 0.31 |
| Number of Estimates in the Fiscal Year Consensus: 3.00 |
Change In Payout Ratio: 0.16 |
| Estmated Long-Term EPS Growth Rate: % |
Last Dividend Paid: 03/02/2026 - $0.36 |
| Next EPS Report Date: 07/27/26 |
|
|
|
| |