| Zacks Company Profile for Ulta Beauty Inc. (ULTA : NSDQ) |
|
|
| |
| • Company Description |
| Ulta Beauty Inc. is a leading beauty retailer in the United States. The company offers a wide range of products including cosmetics, fragrance, skincare, hair care, bath and body products, and salon styling tools in stores. It sells more than 25,000 products from about 500 well-established and emerging beauty brands across all categories and price points. The company operates a full-service salon in every store offering hair, skin and brow services. Additionally, it offers products through its Website, ulta.com, as well as mobile applications.
Number of Employees: 65,000 |
|
|
| |
| • Price / Volume Information |
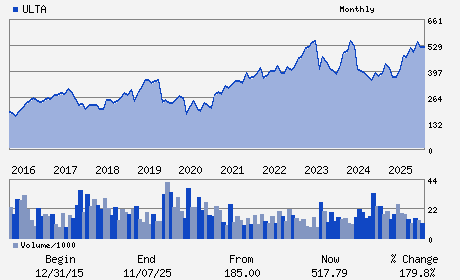
| Yesterday's Closing Price: $539.14 |
Daily Weekly Monthly
 |
| 20 Day Moving Average: 647,325 shares |
| Shares Outstanding: 43.74 (millions) |
| Market Capitalization: $23,580.17 (millions) |
| Beta: 0.95 |
| 52 Week High: $714.97 |
| 52 Week Low: $349.60 |
| Short Interest Ratio: |
| |
% Price Change |
% Price Change Relative to S&P 500 |
| 4 Week |
3.55% |
-2.32% |
| 12 Week |
-21.11% |
-22.77% |
| Year To Date |
-10.89% |
-13.14% |
|
|
|
|
| |
|
|
| |
| • General Corporate Information |
Officers
Kecia L. Steelman - President and Chief Executive Officer
Lorna E. Nagler - Chairman
Christopher J. DelOrefice - Chief Financial Officer
Christopher Lialios - Senior Vice President
Michelle L. Collins - Director
|
|
Peer Information
Ulta Beauty Inc. (COCQ)
Ulta Beauty Inc. (JAS)
Ulta Beauty Inc. (JAS.B)
Ulta Beauty Inc. (HKFIQ)
Ulta Beauty Inc. (CNJ)
Ulta Beauty Inc. (T.CTC)
|
|
Industry / Sector / Ticker Info
Analyst Coverage: No
Industry Group: RETAIL-MISC/DIV
Sector: Retail/Wholesale
CUSIP: 90384S303
SIC: 5990
|
|
Fiscal Year
Fiscal Year End: January
Last Reported Quarter: 01/01/26
Next Expected EPS Date: 06/04/26
|
|
Share - Related Items
Shares Outstanding: 43.74
Most Recent Split Date: (:1)
Beta: 0.95
Market Capitalization: $23,580.17 (millions)
|
|
|
|
|
| |
| • EPS Information |
• Dividend Information |
| Analyst Coverage: No |
Dividend Yield: 0.00% |
| Current Fiscal Quarter EPS Consensus Estimate: $6.94 |
Indicated Annual Dividend: $0.00 |
| Current Fiscal Year EPS Consensus Estimate: $28.47 |
Payout Ratio: 0.00 |
| Number of Estimates in the Fiscal Year Consensus: 14.00 |
Change In Payout Ratio: 0.00 |
| Estmated Long-Term EPS Growth Rate: 9.58% |
Last Dividend Paid: NA - $0.00 |
| Next EPS Report Date: 06/04/26 |
|
|
|
| |