| Zacks Company Profile for Upbound Group, Inc. (UPBD : NSDQ) |
|
|
| |
| • Company Description |
| Upbound Group Inc. is an omni-channel platform company committed to elevating financial opportunity for technology-driven financial solutions. The Company's customer-facing operating units include brands such as Rent-A-Center(R) and Acima(R). Upbound Group Inc., formerly known as Rent-A-Center Inc., is based in PLANO, Texas.
Number of Employees: 12,050 |
|
|
| |
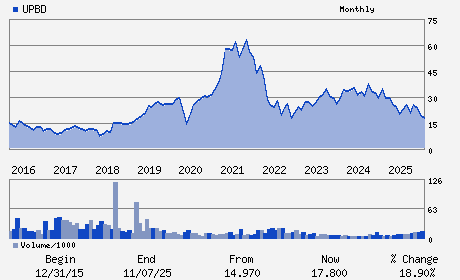
| • Price / Volume Information |
| Yesterday's Closing Price: $19.76 |
Daily Weekly Monthly
 |
| 20 Day Moving Average: 813,303 shares |
| Shares Outstanding: 58.35 (millions) |
| Market Capitalization: $1,153.03 (millions) |
| Beta: 1.83 |
| 52 Week High: $28.03 |
| 52 Week Low: $15.82 |
| Short Interest Ratio: |
| |
% Price Change |
% Price Change Relative to S&P 500 |
| 4 Week |
12.72% |
2.93% |
| 12 Week |
-0.45% |
-6.12% |
| Year To Date |
12.53% |
6.85% |
|
|
|
|
| |
|
|
| |
| • General Corporate Information |
Officers
Fahmi Karam - Chief Executive Officer and Director
Hal Khouri - Chief Financial Officer
Jeffrey Brown - Director
Charu Jain - Director
Molly Langenstein - Director
|
|
Peer Information
Upbound Group, Inc. (CAII)
Upbound Group, Inc. (KPLT)
Upbound Group, Inc. (ELRC)
Upbound Group, Inc. (PMCPE)
Upbound Group, Inc. (IAIS)
Upbound Group, Inc. (UPBD)
|
|
Industry / Sector / Ticker Info
Analyst Coverage: No
Industry Group: FIN-LEASING COS
Sector: Finance
CUSIP: 76009N100
SIC: 7359
|
|
Fiscal Year
Fiscal Year End: December
Last Reported Quarter: 03/01/26
Next Expected EPS Date: 07/30/26
|
|
Share - Related Items
Shares Outstanding: 58.35
Most Recent Split Date: 9.00 (2.50:1)
Beta: 1.83
Market Capitalization: $1,153.03 (millions)
|
|
|
|
|
| |
| • EPS Information |
• Dividend Information |
| Analyst Coverage: No |
Dividend Yield: 7.89% |
| Current Fiscal Quarter EPS Consensus Estimate: $1.08 |
Indicated Annual Dividend: $1.56 |
| Current Fiscal Year EPS Consensus Estimate: $4.12 |
Payout Ratio: 0.38 |
| Number of Estimates in the Fiscal Year Consensus: 2.00 |
Change In Payout Ratio: 0.03 |
| Estmated Long-Term EPS Growth Rate: % |
Last Dividend Paid: 04/07/2026 - $0.39 |
| Next EPS Report Date: 07/30/26 |
|
|
|
| |