| Zacks Company Profile for Valhi, Inc. (VHI : NYSE) |
|
|
| |
| • Company Description |
| Valhi Inc. operates through majority-owned subsidiaries or less than majority-owned affiliates in the chemicals, component products, waste management and titanium metals industries. These subsidiaries and affiliates are NL Industries, Inc. , CompX International Inc., Waste Control Specialists LLC, and Titanium Metal Corporation.
Number of Employees: 2,263 |
|
|
| |
| • Price / Volume Information |
| Yesterday's Closing Price: $12.47 |
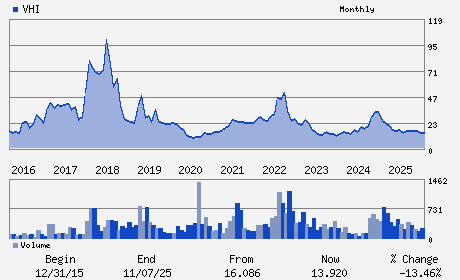
Daily Weekly Monthly
 |
| 20 Day Moving Average: 15,395 shares |
| Shares Outstanding: 28.30 (millions) |
| Market Capitalization: $352.93 (millions) |
| Beta: 0.99 |
| 52 Week High: $20.00 |
| 52 Week Low: $11.44 |
| Short Interest Ratio: |
| |
% Price Change |
% Price Change Relative to S&P 500 |
| 4 Week |
-12.55% |
-16.82% |
| 12 Week |
-11.37% |
-18.07% |
| Year To Date |
3.49% |
-3.41% |
|
|
|
|
| |
|
|
| |
| • General Corporate Information |
Officers
Michael S. Simmons - Chief Executive Officer; President and Vice Chairm
Loretta J. Feehan - Chair of the Board
Amy Allbach Samford - Executive Vice President and Chief Financial Offic
Edward R. Moore - Vice President and Controller
Terri L. Herrington - Director
|
|
Peer Information
Valhi, Inc. (ENFY)
Valhi, Inc. (EMLIF)
Valhi, Inc. (GPLB)
Valhi, Inc. (BCPUQ)
Valhi, Inc. (CYT.)
Valhi, Inc. (SOA)
|
|
Industry / Sector / Ticker Info
Analyst Coverage: No
Industry Group: CHEM-DIVERSIFD
Sector: Basic Materials
CUSIP: 918905209
SIC: 2810
|
|
Fiscal Year
Fiscal Year End: December
Last Reported Quarter: 03/01/26
Next Expected EPS Date: 08/06/26
|
|
Share - Related Items
Shares Outstanding: 28.30
Most Recent Split Date: 6.00 (0.08:1)
Beta: 0.99
Market Capitalization: $352.93 (millions)
|
|
|
|
|
| |
| • EPS Information |
• Dividend Information |
| Analyst Coverage: No |
Dividend Yield: 2.57% |
| Current Fiscal Quarter EPS Consensus Estimate: $ |
Indicated Annual Dividend: $0.32 |
| Current Fiscal Year EPS Consensus Estimate: $ |
Payout Ratio: |
| Number of Estimates in the Fiscal Year Consensus: |
Change In Payout Ratio: |
| Estmated Long-Term EPS Growth Rate: % |
Last Dividend Paid: 03/16/2026 - $0.08 |
| Next EPS Report Date: 08/06/26 |
|
|
|
| |