| Zacks Company Profile for Vistance Networks, Inc. (VISN : NSDQ) |
|
|
| |
| • Company Description |
| CommScope Holding Inc. is a premier network infrastructure provider. The Company, through its subsidiaries, provides end-to-end solutions connecting technology and wireless and wired networks. It operates in three segments: Wireless, Enterprise, and Broadband. CommScope Holding Company, Inc. is headquartered in Hickory, North Carolina.
Number of Employees: 4,500 |
|
|
| |
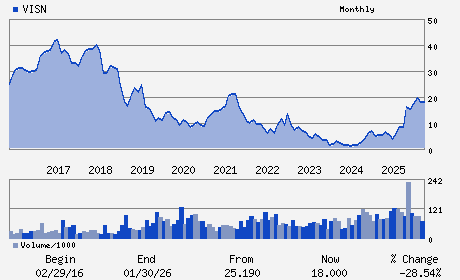
| • Price / Volume Information |
| Yesterday's Closing Price: $18.98 |
Daily Weekly Monthly
 |
| 20 Day Moving Average: 4,597,028 shares |
| Shares Outstanding: 225.46 (millions) |
| Market Capitalization: $4,279.27 (millions) |
| Beta: 2.38 |
| 52 Week High: $20.55 |
| 52 Week Low: $2.94 |
| Short Interest Ratio: |
| |
% Price Change |
% Price Change Relative to S&P 500 |
| 4 Week |
7.47% |
1.38% |
| 12 Week |
5.09% |
2.89% |
| Year To Date |
4.69% |
2.04% |
|
|
|
|
| |
|
|
| |
| • General Corporate Information |
Officers
Charles L. Treadway - President; Chief Executive Officer and Director
Claudius E. Watts - Chairman
Kyle D. Lorentzen - Executive Vice President and Chief Financial offic
Charles A. Gilstrap - Senior Vice President and Chief Accounting officer
Stephen C. Gray - Director
|
|
Peer Information
Vistance Networks, Inc. (GNSS)
Vistance Networks, Inc. (ENETF)
Vistance Networks, Inc. (CLRN)
Vistance Networks, Inc. (UPHN)
Vistance Networks, Inc. (RBBN)
Vistance Networks, Inc. (ZPLSQ)
|
|
Industry / Sector / Ticker Info
Analyst Coverage: No
Industry Group: Comm Network Software
Sector: Computer and Technology
CUSIP: 20337X109
SIC: 3663
|
|
Fiscal Year
Fiscal Year End: December
Last Reported Quarter: 12/01/25
Next Expected EPS Date: 04/30/26
|
|
Share - Related Items
Shares Outstanding: 225.46
Most Recent Split Date: (:1)
Beta: 2.38
Market Capitalization: $4,279.27 (millions)
|
|
|
|
|
| |
| • EPS Information |
• Dividend Information |
| Analyst Coverage: No |
Dividend Yield: 0.00% |
| Current Fiscal Quarter EPS Consensus Estimate: $0.26 |
Indicated Annual Dividend: $0.00 |
| Current Fiscal Year EPS Consensus Estimate: $0.81 |
Payout Ratio: 0.00 |
| Number of Estimates in the Fiscal Year Consensus: 2.00 |
Change In Payout Ratio: 0.00 |
| Estmated Long-Term EPS Growth Rate: 13.48% |
Last Dividend Paid: NA - $0.00 |
| Next EPS Report Date: 04/30/26 |
|
|
|
| |