| Zacks Company Profile for Telefonica Brasil S.A. (VIV : NYSE) |
|
|
| |
| • Company Description |
| Telefonica Brasil SA is engaged in providing communication, information and entertainment solutions in the telecommunication sector, in the State of Sao Paulo. The Company also provides multimedia communication services, local voice services, long-distance services, data services, Pay TV services, land-based wireless technology multichannel multipoint distribution service and network services. Telefonica Brasil SA was formerly known as Telecomunicacoes de Sao Paulo S.A.
Number of Employees: 35,010 |
|
|
| |
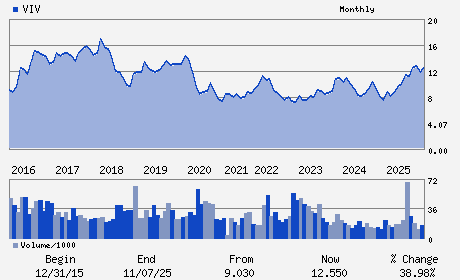
| • Price / Volume Information |
| Yesterday's Closing Price: $13.38 |
Daily Weekly Monthly
 |
| 20 Day Moving Average: 1,064,739 shares |
| Shares Outstanding: 1,626.68 (millions) |
| Market Capitalization: $21,765.02 (millions) |
| Beta: 0.63 |
| 52 Week High: $17.26 |
| 52 Week Low: $9.51 |
| Short Interest Ratio: |
| |
% Price Change |
% Price Change Relative to S&P 500 |
| 4 Week |
-16.27% |
-20.36% |
| 12 Week |
-19.25% |
-25.35% |
| Year To Date |
12.82% |
9.23% |
|
|
|
|
| |
| • Address & Contact Information |
| Street Address |
Phone / Fax |
Email Address |
Web URL |
AVENIDA ENGENHEIRO LUIS CARLOS BERRINI 1376 32ND FLOOR
-
SAO PAULO-SP,D5 04571
BRA |
ph: 55-11-3430-3687
fax: 55-11-5505-1355 |
ir.br@telefonica.com |
http://www.telefonica.com.br |
|
|
| |
| • General Corporate Information |
Officers
Eduardo Navarro de Carvalho - Chairman
Andrea Capelo Pinheiro - Director
Cesar Mascaraque Alonso - Director
Christian Mauad Gebara - Director
Cristina Presz Palmaka de Luca - Director
|
|
Peer Information
Telefonica Brasil S.A. (IDAI.)
Telefonica Brasil S.A. (RPID.)
Telefonica Brasil S.A. (ACTT.)
Telefonica Brasil S.A. (CVST)
Telefonica Brasil S.A. (GTTLQ)
Telefonica Brasil S.A. (BCE)
|
|
Industry / Sector / Ticker Info
Analyst Coverage: No
Industry Group: Diversified Comm Services
Sector: Utilities
CUSIP: 87936R205
SIC: 4813
|
|
Fiscal Year
Fiscal Year End: December
Last Reported Quarter: 03/01/26
Next Expected EPS Date: 07/27/26
|
|
Share - Related Items
Shares Outstanding: 1,626.68
Most Recent Split Date: (:1)
Beta: 0.63
Market Capitalization: $21,765.02 (millions)
|
|
|
|
|
| |
| • EPS Information |
• Dividend Information |
| Analyst Coverage: No |
Dividend Yield: 3.41% |
| Current Fiscal Quarter EPS Consensus Estimate: $0.20 |
Indicated Annual Dividend: $0.46 |
| Current Fiscal Year EPS Consensus Estimate: $0.88 |
Payout Ratio: 0.32 |
| Number of Estimates in the Fiscal Year Consensus: 4.00 |
Change In Payout Ratio: -0.23 |
| Estmated Long-Term EPS Growth Rate: 19.59% |
Last Dividend Paid: 04/28/2026 - $0.09 |
| Next EPS Report Date: 07/27/26 |
|
|
|
| |