| Zacks Company Profile for Vera Bradley, Inc. (VRA : NSDQ) |
|
|
| |
| • Company Description |
| Vera Bradley Designs, Inc. is a designer, producer, marketer and retailer of accessories for women. Its products include handbags, accessories and travel and leisure items. It sells its products through two reportable segments Indirect and Direct. Its indirect business consists of sale of Vera Bradley products to independent retailers in the U.S. as well as select national retailers and third party e-commerce sites. Its direct business consists of sales of Vera Bradley products through its full-price stores, its outlet stores, verabradley.com, and its annual outlet sale in Fort Wayne, Indiana. Vera Bradley Designs, Inc. is headquartered in Fort Wayne, Indiana.
Number of Employees: 1,360 |
|
|
| |
| • Price / Volume Information |
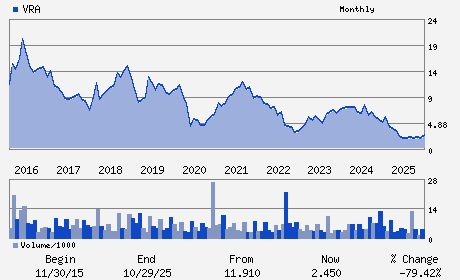
| Yesterday's Closing Price: $3.70 |
Daily Weekly Monthly
 |
| 20 Day Moving Average: 266,780 shares |
| Shares Outstanding: 27.97 (millions) |
| Market Capitalization: $103.47 (millions) |
| Beta: 1.59 |
| 52 Week High: $4.02 |
| 52 Week Low: $1.39 |
| Short Interest Ratio: |
| |
% Price Change |
% Price Change Relative to S&P 500 |
| 4 Week |
4.82% |
-1.13% |
| 12 Week |
40.15% |
37.21% |
| Year To Date |
52.89% |
49.03% |
|
|
|
|
| |
|
|
| |
| • General Corporate Information |
Officers
Ian Bickley - Chief Executive Officer and Executive Chairman
Martin Layding - Chief Operating and Financial Officer
Ivan Brockman - Director
Kristina Cashman - Director
Andrew Meslow - Director
|
|
Peer Information
Vera Bradley, Inc. (CACH)
Vera Bradley, Inc. (DXLG)
Vera Bradley, Inc. (HIBB)
Vera Bradley, Inc. (WALKQ)
Vera Bradley, Inc. (BDST)
Vera Bradley, Inc. (CBKCQ)
|
|
Industry / Sector / Ticker Info
Analyst Coverage: No
Industry Group: RETAIL-APP/SHOE
Sector: Retail/Wholesale
CUSIP: 92335C106
SIC: 3100
|
|
Fiscal Year
Fiscal Year End: January
Last Reported Quarter: 01/01/26
Next Expected EPS Date: 06/10/26
|
|
Share - Related Items
Shares Outstanding: 27.97
Most Recent Split Date: (:1)
Beta: 1.59
Market Capitalization: $103.47 (millions)
|
|
|
|
|
| |
| • EPS Information |
• Dividend Information |
| Analyst Coverage: No |
Dividend Yield: 0.00% |
| Current Fiscal Quarter EPS Consensus Estimate: $-0.33 |
Indicated Annual Dividend: $0.00 |
| Current Fiscal Year EPS Consensus Estimate: $-0.34 |
Payout Ratio: |
| Number of Estimates in the Fiscal Year Consensus: 1.00 |
Change In Payout Ratio: |
| Estmated Long-Term EPS Growth Rate: % |
Last Dividend Paid: NA - $0.00 |
| Next EPS Report Date: 06/10/26 |
|
|
|
| |