| Zacks Company Profile for Veris Residential, Inc. (VRE : NYSE) |
|
|
| |
| • Company Description |
| Veris Residential Inc. is an environmentally and socially-conscious real estate investment trust which primarily owns, operates, acquires and develops holistically-inspired, Class A multifamily properties. Veris Residential Inc., formerly known as Mack-Cali Realty Corporation, is based in JERSEY CITY, N.J.
Number of Employees: 181 |
|
|
| |
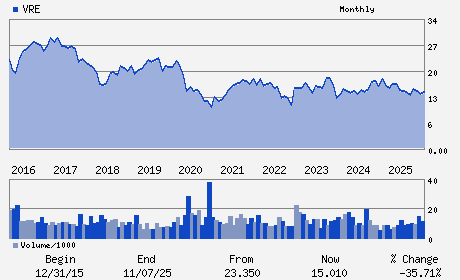
| • Price / Volume Information |
| Yesterday's Closing Price: $19.00 |
Daily Weekly Monthly
 |
| 20 Day Moving Average: 675,819 shares |
| Shares Outstanding: 93.84 (millions) |
| Market Capitalization: $1,782.92 (millions) |
| Beta: 1.07 |
| 52 Week High: $19.03 |
| 52 Week Low: $13.69 |
| Short Interest Ratio: |
| |
% Price Change |
% Price Change Relative to S&P 500 |
| 4 Week |
0.42% |
-4.48% |
| 12 Week |
0.90% |
-6.72% |
| Year To Date |
27.69% |
17.33% |
|
|
|
|
| |
|
|
| |
| • General Corporate Information |
Officers
Mahbod Nia - Chief Executive Officer and Director
Tammy K. Jones - Chairman
Amanda Lombard - Chief Financial Officer
Frederic Cumenal - Director
A. Akiva Katz - Director
|
|
Peer Information
Veris Residential, Inc. (CPT)
Veris Residential, Inc. (BHM)
Veris Residential, Inc. (EQR)
Veris Residential, Inc. (SAFE)
Veris Residential, Inc. (AEC)
Veris Residential, Inc. (VRE)
|
|
Industry / Sector / Ticker Info
Analyst Coverage: No
Industry Group: REIT-EQTY TRUST - RESID
Sector: Finance
CUSIP: 554489104
SIC: 6798
|
|
Fiscal Year
Fiscal Year End: December
Last Reported Quarter: 03/01/26
Next Expected EPS Date: 07/22/26
|
|
Share - Related Items
Shares Outstanding: 93.84
Most Recent Split Date: (:1)
Beta: 1.07
Market Capitalization: $1,782.92 (millions)
|
|
|
|
|
| |
| • EPS Information |
• Dividend Information |
| Analyst Coverage: No |
Dividend Yield: 1.68% |
| Current Fiscal Quarter EPS Consensus Estimate: $ |
Indicated Annual Dividend: $0.32 |
| Current Fiscal Year EPS Consensus Estimate: $0.78 |
Payout Ratio: 0.52 |
| Number of Estimates in the Fiscal Year Consensus: 2.00 |
Change In Payout Ratio: 0.26 |
| Estmated Long-Term EPS Growth Rate: 7.72% |
Last Dividend Paid: 03/31/2026 - $0.08 |
| Next EPS Report Date: 07/22/26 |
|
|
|
| |