| Zacks Company Profile for Wetouch Technology Inc. (WETH : NSDQ) |
|
|
| |
| • Company Description |
| Gulf West Investment Properties, Inc. offers construction services, which include design, development, supervision, and completion; and marketing services, such as design, engineering, permits, architecture, and planning. It also provides real estate brokerage services for developers and individuals. The Company was formerly known as Stratera, Inc.
Number of Employees: 131 |
|
|
| |
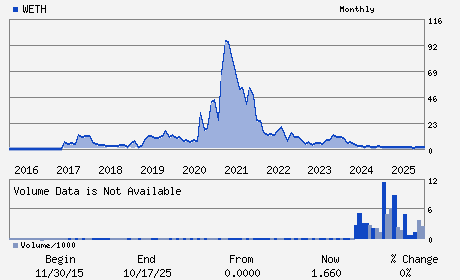
| • Price / Volume Information |
| Yesterday's Closing Price: $1.53 |
Daily Weekly Monthly
 |
| 20 Day Moving Average: 37,306 shares |
| Shares Outstanding: 11.93 (millions) |
| Market Capitalization: $18.25 (millions) |
| Beta: 0.47 |
| 52 Week High: $3.68 |
| 52 Week Low: $0.76 |
| Short Interest Ratio: |
| |
% Price Change |
% Price Change Relative to S&P 500 |
| 4 Week |
10.07% |
3.83% |
| 12 Week |
-14.52% |
-16.32% |
| Year To Date |
14.18% |
11.29% |
|
|
|
|
| |
| • Address & Contact Information |
| Street Address |
Phone / Fax |
Email Address |
Web URL |
NO.29 THE THIRD MAIN AVENUE SHIGAO TOWN RENSHOU COUNTY
-
MEISHAN CITY,F4 620500
CHN |
ph: 86-28-3739-0666
fax: - |
None |
http://www.wetouchinc.com |
|
|
| |
| • General Corporate Information |
Officers
Zongyi Lian - Chief Executive Officer and President
Guangrong Cai - Chairman
Xing Tang - Chief Financial Officer
Jian Feng - Secretary
Jiaxing Huang - Director
|
|
Peer Information
Wetouch Technology Inc. (ATEA)
Wetouch Technology Inc. (BITS.)
Wetouch Technology Inc. (DCTM)
Wetouch Technology Inc. (DLVAZ)
Wetouch Technology Inc. (DOCC)
Wetouch Technology Inc. (NEON)
|
|
Industry / Sector / Ticker Info
Analyst Coverage: No
Industry Group: COMP-SOFTWARE
Sector: Computer and Technology
CUSIP: 961881208
SIC: 3577
|
|
Fiscal Year
Fiscal Year End: December
Last Reported Quarter: 12/01/25
Next Expected EPS Date: 10/14/26
|
|
Share - Related Items
Shares Outstanding: 11.93
Most Recent Split Date: 9.00 (0.05:1)
Beta: 0.47
Market Capitalization: $18.25 (millions)
|
|
|
|
|
| |
| • EPS Information |
• Dividend Information |
| Analyst Coverage: No |
Dividend Yield: 0.00% |
| Current Fiscal Quarter EPS Consensus Estimate: $ |
Indicated Annual Dividend: $0.00 |
| Current Fiscal Year EPS Consensus Estimate: $ |
Payout Ratio: |
| Number of Estimates in the Fiscal Year Consensus: |
Change In Payout Ratio: |
| Estmated Long-Term EPS Growth Rate: % |
Last Dividend Paid: NA - $0.00 |
| Next EPS Report Date: 10/14/26 |
|
|
|
| |