| Zacks Company Profile for Wyndham Hotels & Resorts (WH : NYSE) |
|
|
| |
| • Company Description |
| Wyndham Hotels and Resorts provide hotel and resort chain. It operates primarily in Canada, Mexico, Colombia, Ecuador, Turkey, Germany, the UK, the Caribbean and Margarita Island in Venezuela. Wyndham Hotels and Resorts is headquartered in New Jersey, United States.
Number of Employees: 2,000 |
|
|
| |
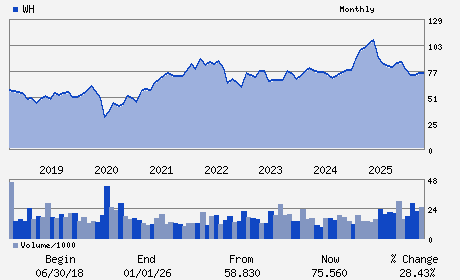
| • Price / Volume Information |
| Yesterday's Closing Price: $87.54 |
Daily Weekly Monthly
 |
| 20 Day Moving Average: 1,127,205 shares |
| Shares Outstanding: 75.05 (millions) |
| Market Capitalization: $6,570.03 (millions) |
| Beta: 0.69 |
| 52 Week High: $92.69 |
| 52 Week Low: $69.21 |
| Short Interest Ratio: |
| |
% Price Change |
% Price Change Relative to S&P 500 |
| 4 Week |
11.52% |
5.19% |
| 12 Week |
10.02% |
7.71% |
| Year To Date |
15.85% |
12.93% |
|
|
|
|
| |
|
|
| |
| • General Corporate Information |
Officers
Geoffrey A. Ballotti - President; Chief Executive Officer and Director
Stephen P. Holmes - Non-Executive Chairman
Kurt Albert - Chief Financial Officer
Nicola Rossi - Chief Accounting Officer
Myra J. Biblowit - Director
|
|
Peer Information
Wyndham Hotels & Resorts (HOT.)
Wyndham Hotels & Resorts (CHH)
Wyndham Hotels & Resorts (ESA.)
Wyndham Hotels & Resorts (GPSRY)
Wyndham Hotels & Resorts (FS)
Wyndham Hotels & Resorts (CLMDY)
|
|
Industry / Sector / Ticker Info
Analyst Coverage: No
Industry Group: HOTELS & MOTELS
Sector: Consumer Discretionary
CUSIP: 98311A105
SIC: 7011
|
|
Fiscal Year
Fiscal Year End: December
Last Reported Quarter: 12/01/25
Next Expected EPS Date: 04/29/26
|
|
Share - Related Items
Shares Outstanding: 75.05
Most Recent Split Date: (:1)
Beta: 0.69
Market Capitalization: $6,570.03 (millions)
|
|
|
|
|
| |
| • EPS Information |
• Dividend Information |
| Analyst Coverage: No |
Dividend Yield: 1.96% |
| Current Fiscal Quarter EPS Consensus Estimate: $1.37 |
Indicated Annual Dividend: $1.72 |
| Current Fiscal Year EPS Consensus Estimate: $4.82 |
Payout Ratio: 0.36 |
| Number of Estimates in the Fiscal Year Consensus: 7.00 |
Change In Payout Ratio: -0.02 |
| Estmated Long-Term EPS Growth Rate: 8.02% |
Last Dividend Paid: 03/20/2026 - $0.43 |
| Next EPS Report Date: 04/29/26 |
|
|
|
| |