| Zacks Company Profile for John Wiley & Sons, Inc. (WLY : NYSE) |
|
|
| |
| • Company Description |
| John Wiley & Sons, Inc. is a global provider of knowledge and knowledge-enabled services that improve outcomes in areas of research, professional practice and education. Through the Research segment, the company provides digital and print scientific, technical, medical and scholarly journals, reference works, books, database services, and advertising. The Professional Development segment provides digital and print books, online assessment and training services, and test prep and certification. In Education, Wiley provides education solutions including online program management services for higher education institutions and course management tools for instructors and students, as well as print and digital content. Their Workplace Learning Solutions business creates products and assessment services geared toward organizational and professional development.
Number of Employees: 5,200 |
|
|
| |
| • Price / Volume Information |
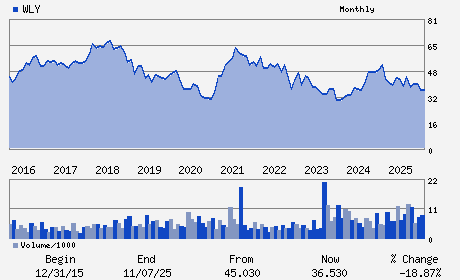
| Yesterday's Closing Price: $40.29 |
Daily Weekly Monthly
 |
| 20 Day Moving Average: 476,158 shares |
| Shares Outstanding: 51.32 (millions) |
| Market Capitalization: $2,067.80 (millions) |
| Beta: 0.80 |
| 52 Week High: $45.64 |
| 52 Week Low: $28.38 |
| Short Interest Ratio: |
| |
% Price Change |
% Price Change Relative to S&P 500 |
| 4 Week |
9.99% |
3.75% |
| 12 Week |
27.91% |
25.22% |
| Year To Date |
31.54% |
28.21% |
|
|
|
|
| |
|
|
| |
| • General Corporate Information |
Officers
Matthew S. Kissner - Chief Executive Officer and President
Jesse C. Wiley - Chairman
Christopher F. Caridi - Senior Vice President; Chief Accounting Officer an
Mari J. Baker - Director
David C. Dobson - Director
|
|
Peer Information
John Wiley & Sons, Inc. (GWOX)
John Wiley & Sons, Inc. (PDYPY)
John Wiley & Sons, Inc. (AMEP)
John Wiley & Sons, Inc. (TNMB)
John Wiley & Sons, Inc. (SCHL)
John Wiley & Sons, Inc. (HTN)
|
|
Industry / Sector / Ticker Info
Analyst Coverage: No
Industry Group: PUBLSHG-BOOKS
Sector: Consumer Staples
CUSIP: 968223206
SIC: 2731
|
|
Fiscal Year
Fiscal Year End: April
Last Reported Quarter: 01/01/26
Next Expected EPS Date: 06/16/26
|
|
Share - Related Items
Shares Outstanding: 51.32
Most Recent Split Date: 6.00 (2.00:1)
Beta: 0.80
Market Capitalization: $2,067.80 (millions)
|
|
|
|
|
| |
| • EPS Information |
• Dividend Information |
| Analyst Coverage: No |
Dividend Yield: 3.52% |
| Current Fiscal Quarter EPS Consensus Estimate: $1.65 |
Indicated Annual Dividend: $1.42 |
| Current Fiscal Year EPS Consensus Estimate: $4.20 |
Payout Ratio: 0.36 |
| Number of Estimates in the Fiscal Year Consensus: 1.00 |
Change In Payout Ratio: -0.05 |
| Estmated Long-Term EPS Growth Rate: % |
Last Dividend Paid: NA - $0.00 |
| Next EPS Report Date: 06/16/26 |
|
|
|
| |